altcoin due diligence
altcoin fundamentals
altcoin investing guide
altcoin investment strategy
altcoin research
Altcoin Season
altcoin selection
altcoin signals
altcoin tokenomics
altcoin trading signals
bitcoin dominance
crypto market rotation
crypto portfolio allocation
crypto research tools
DeFi research
early altcoin identification
how to find altcoins early
onchain data analysis
spot winning altcoins
token analysis
Coinposters
How to Spot Winning Altcoins Before The Crowd Moves
To spot winning altcoins before the crowd moves, you need to monitor Bitcoin dominance trends, track onchain data signals, and understand token fundamentals — not wait for price charts to confirm what smart money already positioned weeks ago. The pattern is predictable, the signals are visible, and this guide shows you exactly where to look.
Article At A Glance
- •Bitcoin dominance dropping below 50% is one of the earliest signals that capital is rotating into altcoins and you can spot winning altcoins by tracking this metric on TradingView
- •Onchain data like wallet growth, active addresses, and stablecoin inflows reveal real demand long before price charts react
- •Most retail investors buy altcoins after the move has already happened — this guide shows you how to position before the crowd arrives
- •Token fundamentals including vesting schedules, developer activity, and token unlock events separate winning altcoins from projects that collapse after launch
- •Sector rotation follows a predictable pattern: large-cap altcoins like Ethereum and Solana move first, followed by mid-caps, then small-cap and narrative-driven tokens
Table of Contents
- Most Altcoin Investors Are Already Too Late
- What Makes an Altcoin a Winner Before It Pumps
- Bitcoin Dominance Is Your First Warning Signal
- Onchain Data Reveals What Price Charts Hide
- How to Evaluate Altcoin Fundamentals Like a Pro
- Sentiment and Social Signals That Precede Big Moves
- The Rotation Playbook: Where Capital Moves First
- How to Avoid Altcoins That Look Good But Fail
- The Tools Every Altcoin Hunter Should Bookmark
- False Signals Will Cost You Money If You Ignore This
- Preparation Beats Prediction Every Time in Crypto
- Frequently Asked Questions
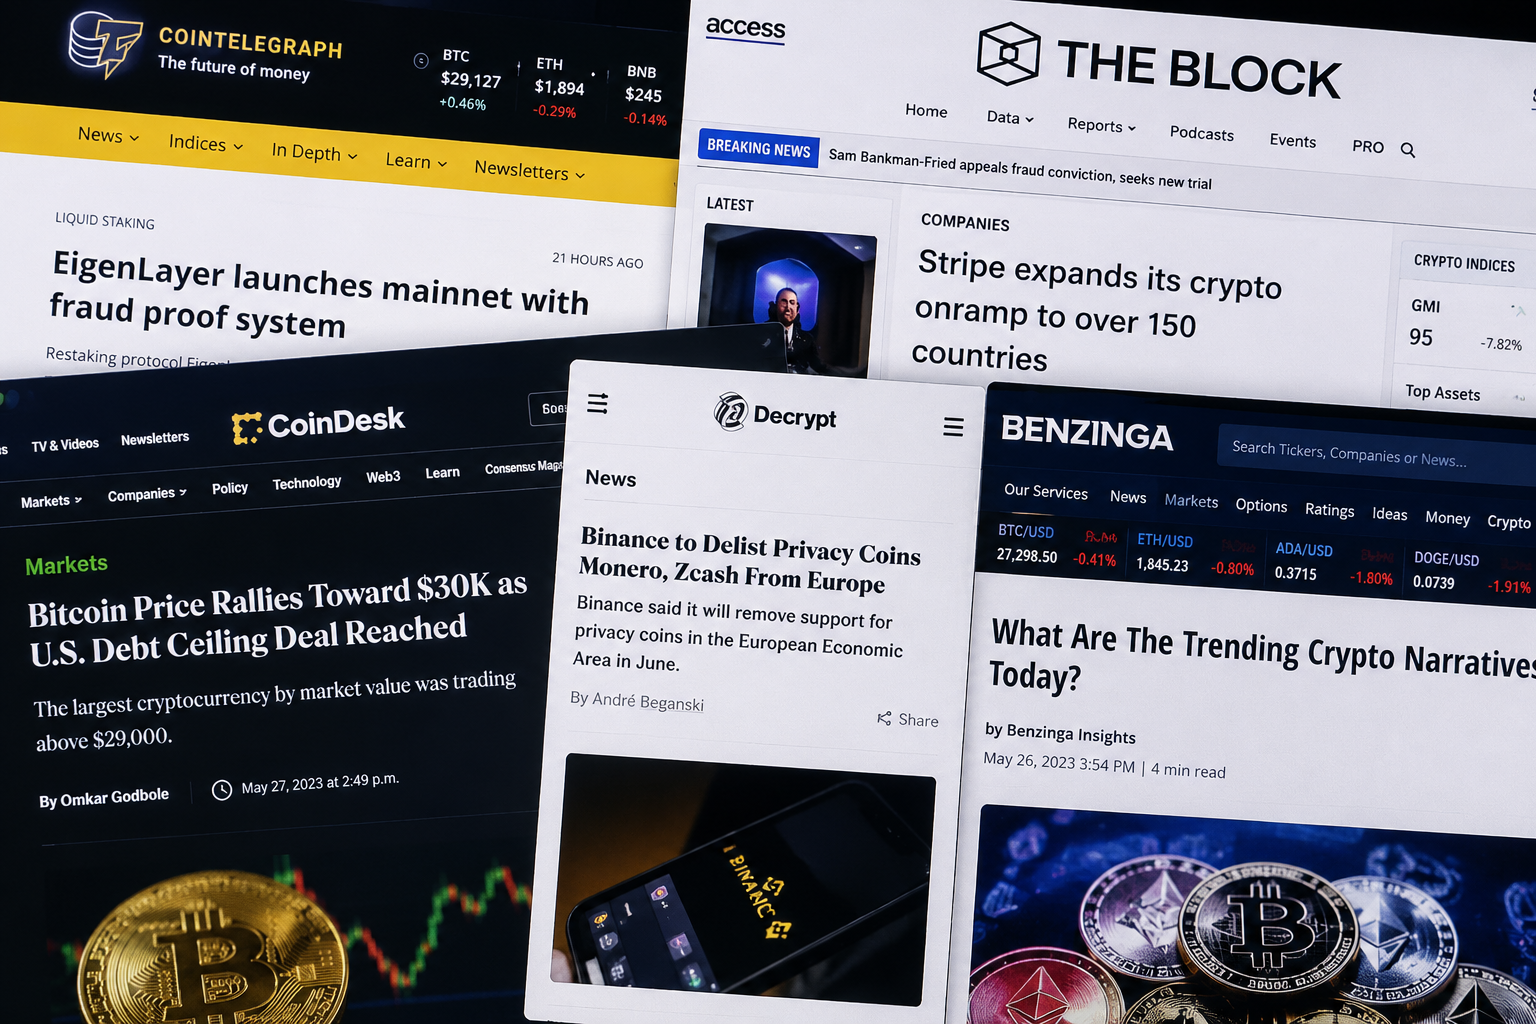
By the time your feed is flooded with altcoin gains, the best entries are already gone. Finding winning altcoins before they run is less about luck and more about knowing where to look and what signals to track. The crypto market is not random — it follows patterns driven by liquidity rotation, narrative cycles, and onchain behavior that show up in the data well before they show up in price. Platforms like those tracking real-time crypto market intelligence make this kind of early research far more accessible than it used to be.
Most Altcoin Investors Are Already Too Late
Here is the uncomfortable truth: most people who think they are early are actually late. By the time an altcoin is trending on X (formerly Twitter), getting covered by crypto YouTube channels, and showing up in Discord servers, the smart money has already positioned. The gains that look so attractive in screenshots? Those belong to people who bought weeks or months before the noise started.
The pattern repeats every cycle. Bitcoin rallies first, capturing headlines and institutional attention. Then, as Bitcoin’s gains slow and dominance begins to fall, liquidity flows outward into Ethereum, then large-cap altcoins, then mid-caps, and finally into the speculative long tail of small-cap tokens and memecoins. Understanding where you are in that rotation — and positioning ahead of the next step — is what separates consistently profitable altcoin investors from those chasing pumps.
What Makes an Altcoin a Winner Before It Pumps
Not every altcoin that runs is worth holding, and not every project with strong fundamentals will pump on your timeline. But there are consistent characteristics shared by altcoins that generate real, sustained gains rather than one-day spikes followed by brutal retracements.
The Difference Between Early Movers and Late Buyers
Early movers research projects when trading volume is low, communities are small, and price action is quiet. They are reading whitepapers, checking GitHub commit history, and watching wallet accumulation data — not waiting for a price alert. Late buyers respond to price. They see a 40% candle, feel urgency, and buy into resistance just as early movers are beginning to take profit. The entry point is everything in altcoin investing, and entry points are built through research, not reaction.
Why Token Fundamentals Matter More Than Hype
Hype can drive a token up 5x in a week. Bad tokenomics can bring it back down in two days. A project might have a compelling narrative and strong community sentiment, but if 30% of the total supply is unlocking in 90 days and team wallets are sitting on millions of tokens at a near-zero cost basis, the price ceiling is capped by sell pressure that most retail investors never see coming. Real winners have sustainable token supply mechanics, genuine product usage, and teams with track records — not just roadmaps. For a deeper understanding of these concepts, explore this beginner guide to blockchain technology.
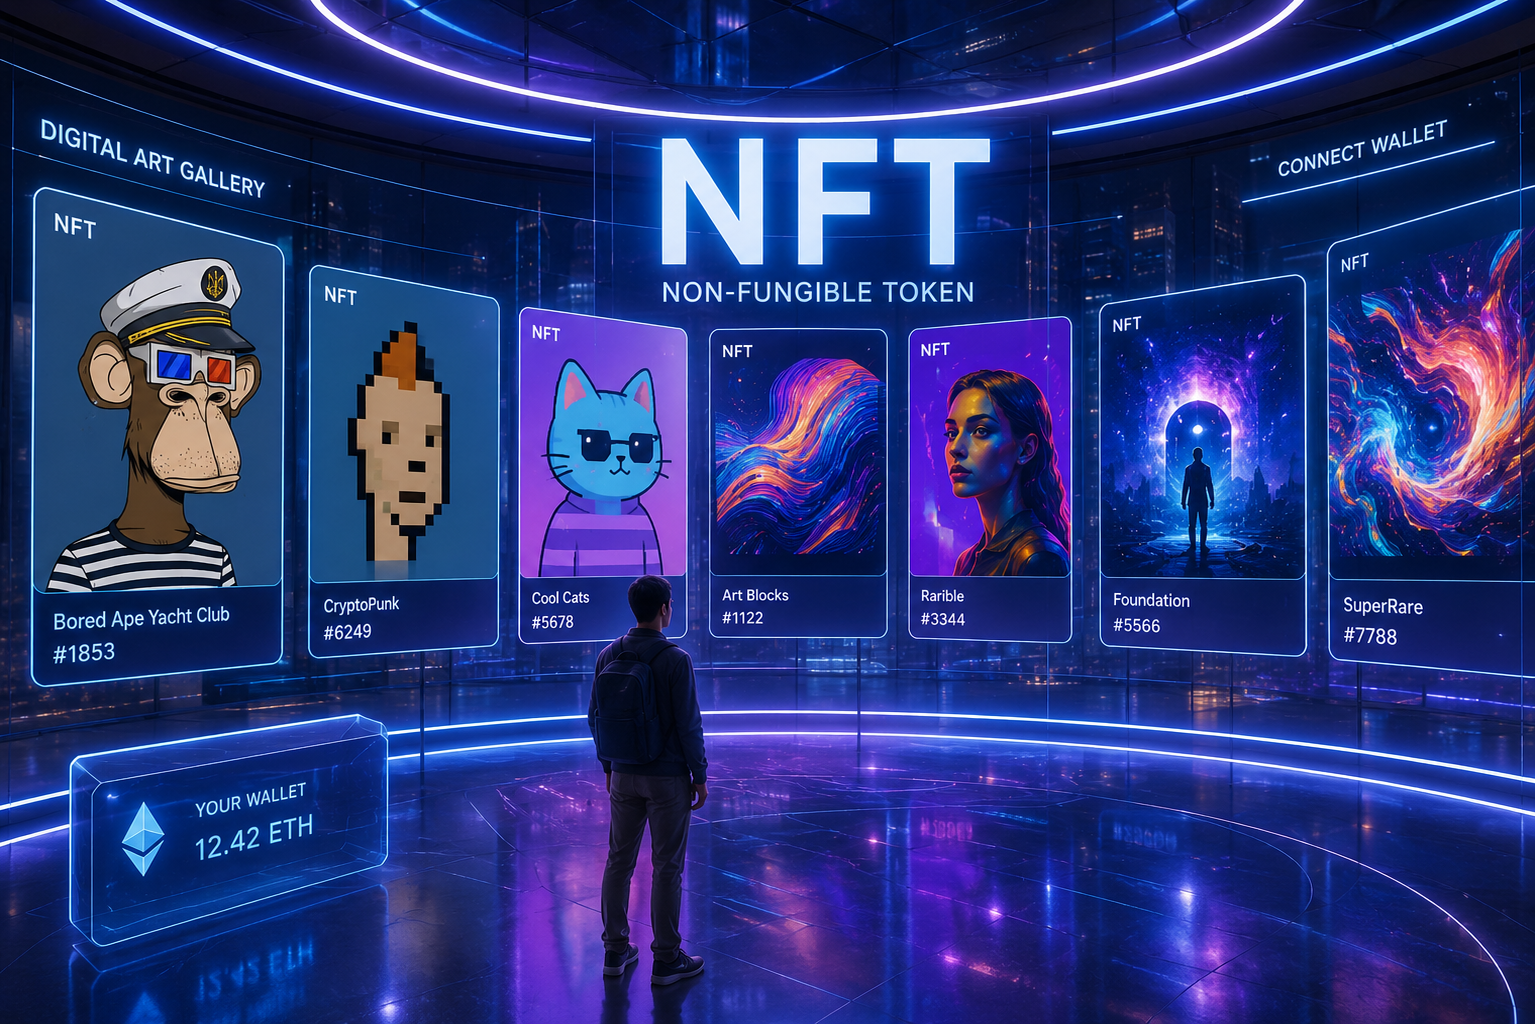
The Role of Narrative Cycles in Altcoin Runs
Crypto markets run on narratives. In 2020 and 2021, DeFi and NFTs were the dominant narratives. In 2023, it was Bitcoin Ordinals and liquid staking. In 2024 and into 2025, real-world assets (RWAs), AI-adjacent tokens, and Layer 2 scaling solutions captured serious capital flows. Narratives concentrate liquidity into specific sectors, and sectors that are early in a narrative cycle tend to outperform everything else in the market. Identifying the next dominant narrative — before it becomes consensus — is one of the highest-leverage skills an altcoin investor can develop.
Bitcoin Dominance Is Your First Warning Signal
Before you research a single altcoin, check Bitcoin dominance. This single metric — the percentage of total crypto market cap held by Bitcoin — tells you more about where the market is headed than almost any other indicator. When BTC dominance is rising, capital is consolidating into Bitcoin and altcoins are generally bleeding. When it falls, capital is rotating out and altcoin season conditions are building.
Historically, sustained drops in Bitcoin dominance below the 50% threshold have preceded some of the most explosive altcoin rallies on record. The 2021 altcoin season saw BTC dominance fall from roughly 70% in January to below 40% by May, during which time Ethereum gained over 400% and dozens of smaller altcoins delivered 10x to 100x returns.
That rotation did not happen overnight — it was visible in the dominance chart weeks before it showed up in individual token prices.
How to Read the Bitcoin Dominance Chart
You can track Bitcoin dominance in real time on TradingView using the ticker BTC.D. What you are looking for is not just the raw number but the trend and momentum. A dominance chart that has been declining for several weeks while total crypto market cap is rising is a strong signal that capital is actively rotating into altcoins. Pair this with the 20-day and 50-day moving averages on the dominance chart — when BTC.D crosses below its 50-day MA during a broader bull market, historically that has marked the early stages of significant altcoin outperformance.
What a Drop in BTC Dominance Actually Means for Altcoins
A falling BTC dominance does not mean Bitcoin is crashing. It means Bitcoin is growing more slowly than the rest of the market. Capital that has been sitting in Bitcoin — or in stablecoins waiting for a signal — begins flowing into Ethereum first, then into large-cap altcoins like Solana, Avalanche, and Chainlink, and eventually into smaller, higher-risk tokens. The key insight is that this rotation has a sequence, and recognizing where in the sequence the market currently sits tells you which tier of altcoins is next in line for inflows.
The Altcoin Season Index and How to Use It
The Altcoin Season Index, tracked by Blockchaincenter.net, measures whether altcoins are outperforming Bitcoin over a 90-day rolling window. A score above 75 indicates altcoin season — meaning 75% or more of the top 50 altcoins have outperformed Bitcoin over the period. A score below 25 signals Bitcoin season. This index is most useful as a confirmation tool rather than a leading indicator. If BTC dominance is already falling and the index is climbing toward the 75 threshold, you are in the early stages of a rotation that statistically has further to run.
Onchain Data Reveals What Price Charts Hide
Price charts show you what already happened. Onchain data shows you what is happening right now at the network level — wallet activity, token accumulation, protocol usage, and capital flows — before any of it shows up in price. Investors who learn to read onchain signals consistently position earlier than those relying on technical analysis alone.
Wallet Growth and Active Address Trends
Rising unique wallet counts and growing daily active addresses are two of the clearest signs that genuine adoption is expanding on a given network. A token whose price is flat but whose active address count has been growing for 60 consecutive days is accumulating real users — and historically, user growth precedes price appreciation in fundamentally sound projects. Tools like Glassnode, Nansen, and Token Terminal let you track these metrics across chains and individual protocols. For a deeper understanding of blockchain’s impact, you can explore blockchain technology explained.
Onchain Metrics Worth Tracking Per Token
| Metric | What It Tells You | Where to Track |
|---|---|---|
| Daily Active Addresses | Real network usage and user growth | Glassnode, Etherscan |
| New Wallet Creation Rate | Expanding adoption over time | Nansen, Dune Analytics |
| Token Velocity | How frequently tokens change hands | Token Terminal |
| Net Exchange Flows | Whether tokens are moving to or from exchanges | Glassnode, CryptoQuant |
| Stablecoin Inflows | Dry powder entering the ecosystem | CryptoQuant, DeFiLlama |
When active addresses are rising alongside net exchange outflows — meaning tokens are being withdrawn from exchanges into private wallets — that combination signals accumulation. Holders are pulling tokens off exchanges, reducing available sell-side liquidity, which is historically bullish for price.
Token Holder Distribution and Whale Concentration Risks
Example — Concentration Risk in Practice: If the top 10 wallets hold 60% or more of a token’s circulating supply and those wallets are not publicly identified smart contracts or exchange cold wallets, the token carries extreme concentration risk. A single large holder deciding to exit can wipe out weeks of price gains in a matter of hours.
Healthy altcoins show a broad and growing distribution of holders over time. You want to see the percentage of supply held by the top 10 wallets declining as a project matures — meaning tokens are moving from early insiders and whales into a wider holder base. When that distribution is improving, it typically reflects genuine organic demand rather than coordinated accumulation ahead of a dump.
Use tools like Etherscan’s token holder tab, Nansen’s Smart Money tracker, or Bubblemaps to visualize wallet concentration and identify whether large holders are accumulating or distributing. Bubblemaps in particular is excellent for spotting clusters of connected wallets that might indicate coordinated insider activity or wash trading.
Pay specific attention to wallets that received tokens at launch or through early private sales. These are the addresses most likely to sell at the first sign of price strength, especially if their tokens were acquired at fractions of the current market price. Checking whether these wallets have been active or dormant is a quick way to assess near-term sell pressure.
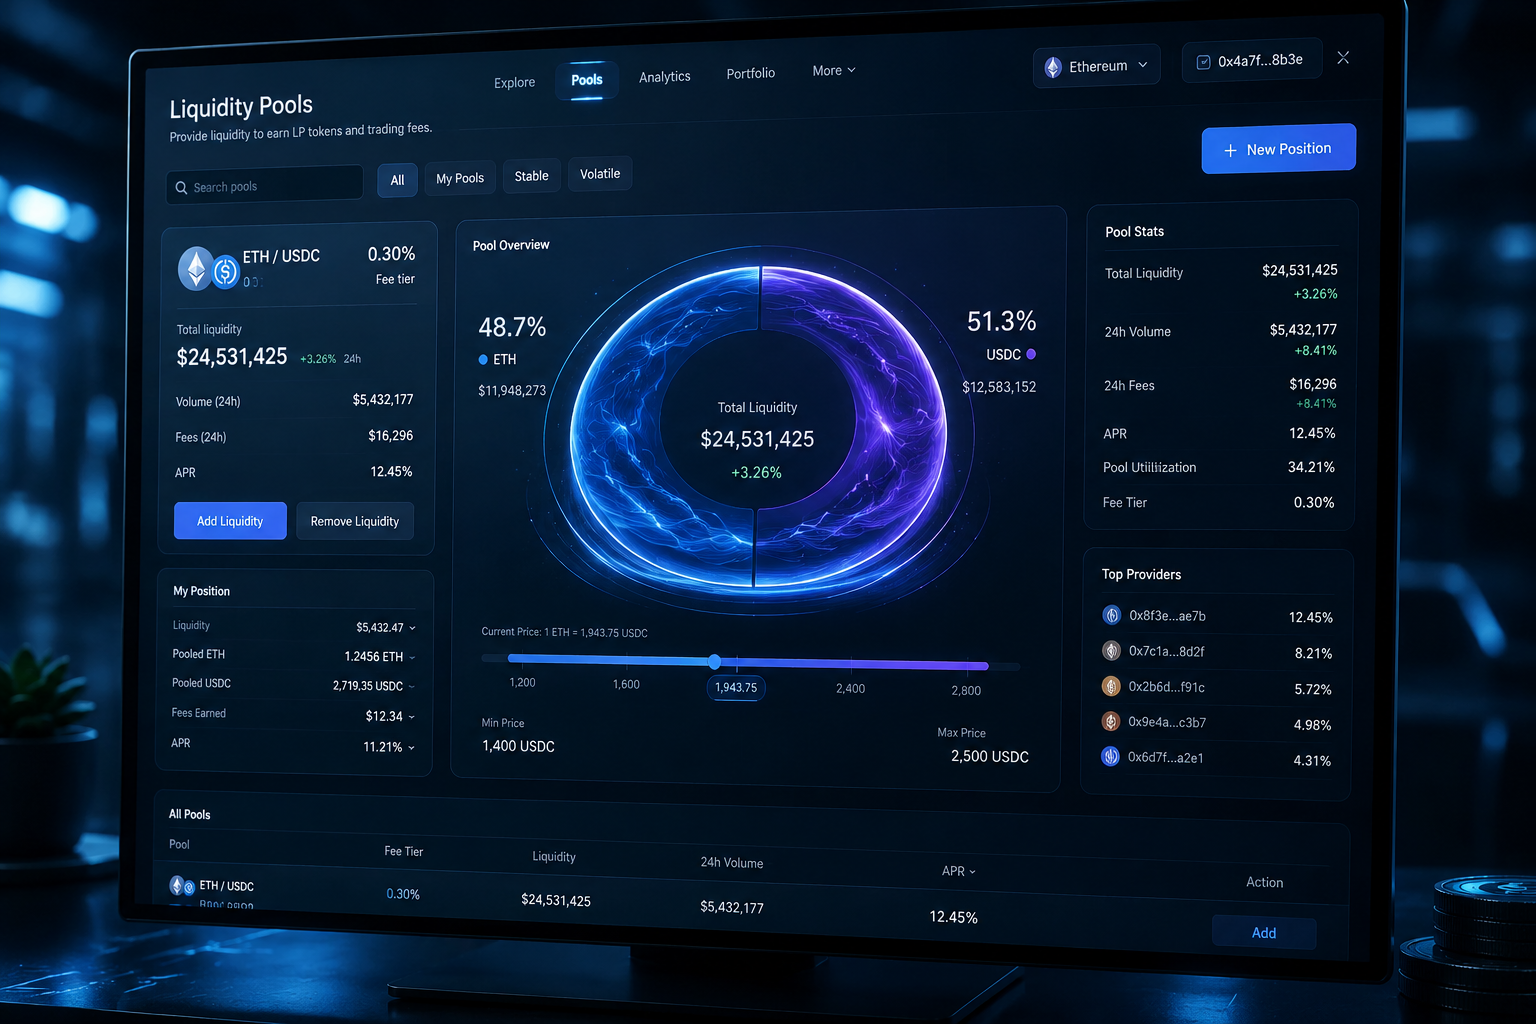
Total Value Locked as a Demand Signal
Total Value Locked (TVL) measures how much capital is deposited and actively being used within a DeFi protocol. A rising TVL means users trust the protocol enough to commit real capital to it — through liquidity provision, lending, staking, or yield strategies. DeFiLlama is the gold standard for tracking TVL across every major chain and protocol, and it updates in near real time.
The most useful signal is not raw TVL but TVL growth rate relative to token market cap. A protocol with $500 million TVL and a $200 million market cap (a price-to-TVL ratio below 1) is often considered undervalued relative to the capital it is already managing. Conversely, a protocol with $50 million TVL and a $2 billion market cap is priced heavily on speculation rather than actual usage — a risk profile worth understanding before entering a position.
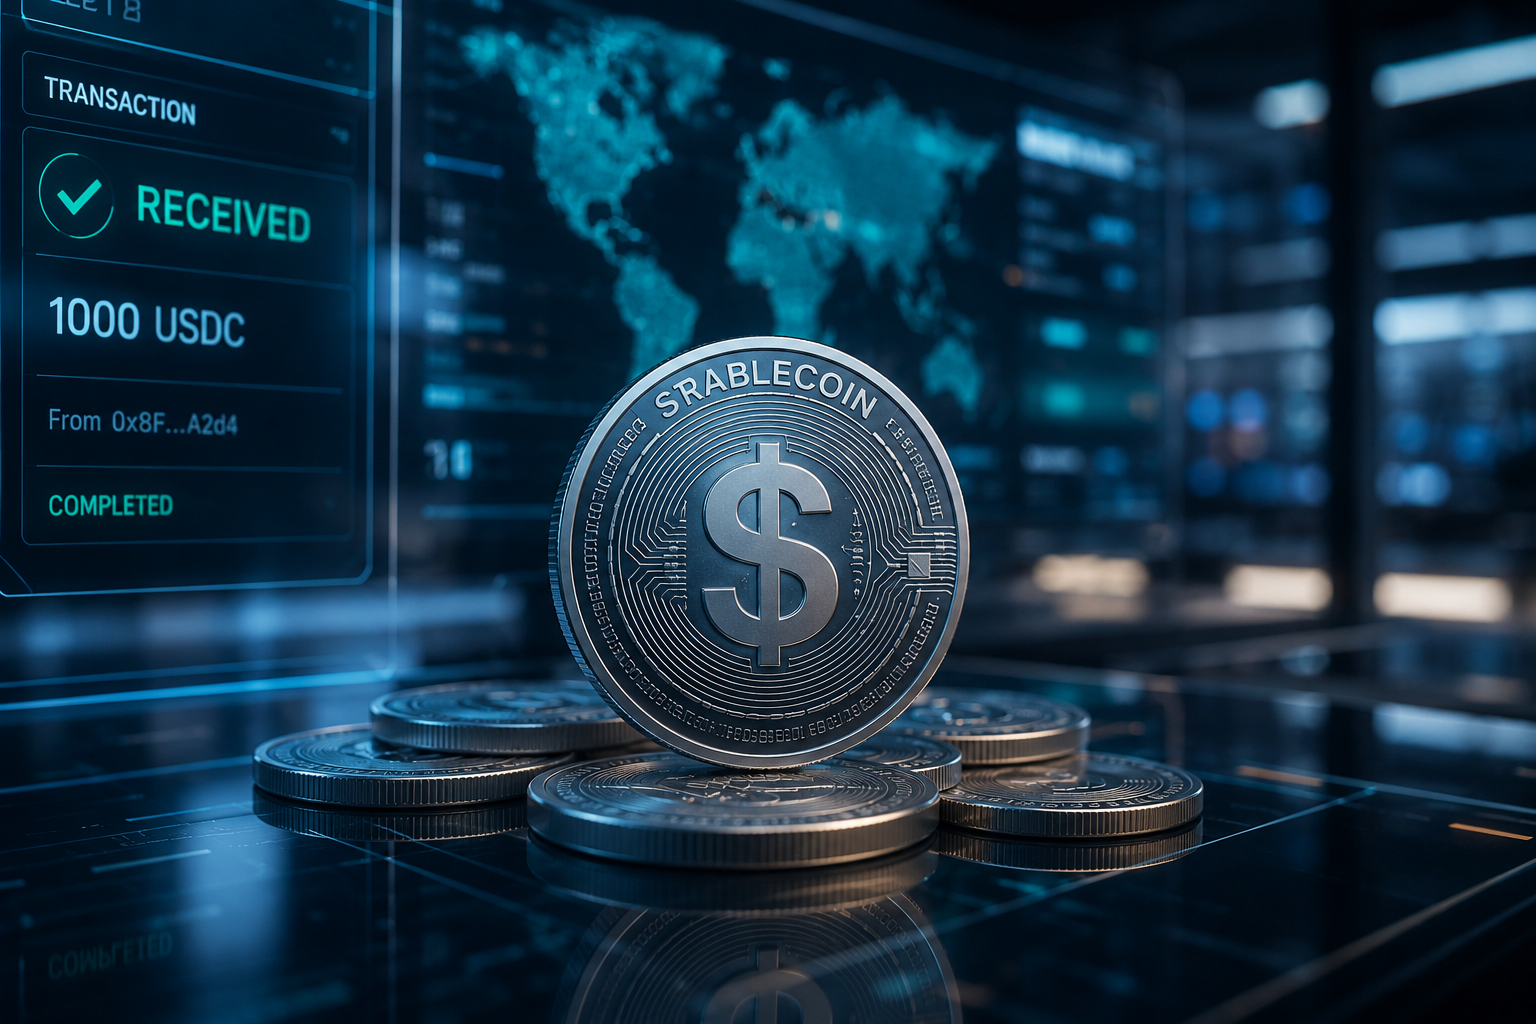
Stablecoin Inflows as Fuel for Altcoin Rallies
Stablecoins sitting on exchanges represent dry powder — capital that is positioned and ready to buy. When stablecoin balances on major exchanges like Binance, Coinbase, and OKX start rising sharply, it signals that investors are moving capital into position without yet committing to specific tokens. This buildup of exchange-side stablecoin liquidity is one of the most reliable pre-conditions for a broad altcoin rally, and CryptoQuant tracks it in real time across all major platforms.
Watch specifically for the Stablecoin Supply Ratio (SSR) — a metric that compares Bitcoin’s market cap to the total stablecoin supply. When the SSR is low, there is significant stablecoin purchasing power relative to Bitcoin’s size, meaning the market has the fuel to push altcoin prices meaningfully higher. A falling SSR during a period of rising total market cap is one of the strongest confluence signals available to altcoin investors.
How to Evaluate Altcoin Fundamentals Like a Pro
Price action without fundamentals is gambling. Fundamentals without timing is frustrating. But combining a solid understanding of what makes a project genuinely valuable with the market timing signals covered above — that is where consistently profitable altcoin investing lives. Evaluating fundamentals does not require a finance degree, but it does require knowing exactly what to look for and where to find it.
Quick Fundamental Scorecard for Any Altcoin
| Criteria | Green Flag | Red Flag |
|---|---|---|
| Token Supply Schedule | Gradual, transparent emissions | Large unlocks within 6 months |
| GitHub Activity | Daily commits, active contributors | No updates in 60+ days |
| Team Transparency | Doxxed team with verifiable history | Anonymous team, no LinkedIn presence |
| Protocol Revenue | Growing fee generation from real users | Zero revenue, pure speculation |
| Backer Quality | Tier-1 VCs: a16z, Paradigm, Multicoin | Unknown backers or no disclosed investors |
| Community Engagement | Organic growth, active governance | Bot-inflated followers, no governance activity |
Run every altcoin you are considering through this scorecard before you look at the chart. A token that scores well across most of these criteria and is sitting at a low market cap relative to its fundamentals is the definition of an asymmetric opportunity. One that fails multiple criteria but has a compelling price chart is almost always a trap.
The goal is not to find perfect projects — those rarely exist in early-stage crypto. The goal is to find projects where the risk-reward ratio is genuinely skewed in your favor, where the downside is limited by real usage and the upside is amplified by an incoming narrative or market rotation.
Tokenomics: Supply Schedules, Inflation, and Unlock Events
Tokenomics is the single most overlooked factor by retail altcoin investors, and it is responsible for more portfolio losses than almost anything else. A token’s supply schedule determines how many new tokens enter circulation over time and who controls them. If a large percentage of supply is allocated to the team, early investors, or venture funds — and those allocations are unlocking soon — the sell pressure can be overwhelming regardless of how good the project fundamentals are.
Use TokenUnlocks.app to check the vesting and unlock schedule for any token before buying. Look for cliff unlocks — large one-time releases of tokens — that are scheduled within the next three to six months. These events create predictable, date-driven sell pressure that can cap or reverse price appreciation. Conversely, tokens that have already passed their major unlock events and are trading with a clean supply schedule have significantly reduced overhead from insider selling. For those interested in understanding more about the underlying technology, you can explore blockchain technology explained in this comprehensive guide.
Developer Activity on GitHub as a Credibility Check
A blockchain project that is not being actively developed is a project that is dying, regardless of what the price is doing. GitHub commit history is publicly visible for most open-source crypto protocols and gives you a direct, unfiltered view of whether a team is actually building. Look for consistent daily or weekly commits across multiple contributors — not bursts of activity followed by weeks of silence, which can indicate a team pushing cosmetic updates to create the appearance of progress.
Artemis Terminal and Token Terminal both aggregate developer activity metrics across hundreds of protocols, letting you compare commit frequency, contributor counts, and code change volume side by side. A project ranking in the top quartile for developer activity relative to its market cap is one of the most underrated signals of long-term potential in the altcoin space.
Team Transparency and Protocol Backing
Who built the project and who funded it matters enormously. Tier-1 venture capital backing from firms like Andreessen Horowitz (a16z), Paradigm, or Multicoin Capital does not guarantee success, but it does signal that sophisticated investors with deep crypto experience ran due diligence and decided the project had merit. It also means the project has runway, connections, and resources that underfunded competitors lack.
Team Verification Checklist
- →Check the project’s official documentation or blog for named investors and verify those investors actually announced the investment on their own channels
- →Search the team’s names on LinkedIn and cross-reference their claimed backgrounds with verifiable previous roles
- →Look up whether team members have previously built or contributed to other legitimate crypto projects
- →Check if the protocol has undergone third-party smart contract audits from recognized firms like Certik, Trail of Bits, or OpenZeppelin
- →Verify that the project’s treasury and fund allocation are disclosed — anonymous or undisclosed treasuries are a serious red flag
Anonymity is not automatically disqualifying — Bitcoin’s pseudonymous origins and projects like early Yearn Finance have proven that anonymous teams can build legitimate protocols. But anonymous teams without audit history, without disclosed backers, and without verifiable on-chain track records represent a materially higher risk profile that should be priced into your position sizing.
Protocol backing also extends beyond just venture capital. Whether a project has been formally integrated into major ecosystems — Ethereum Foundation grants, Solana Foundation support, Chainlink BUILD program membership — signals institutional endorsement that carries real weight. These organizations do not distribute grants or partnerships carelessly, and their backing adds a layer of credibility that pure VC funding sometimes lacks.
When you combine a transparent, experienced team with credible backers and a live product that is generating real usage, you have the foundation of an altcoin worth taking seriously. The market may not have priced it fairly yet — but it will.
Sentiment and Social Signals That Precede Big Moves
Price follows attention in crypto, and attention is measurable before it becomes mainstream. Social volume, search trends, and sentiment data give you a window into where crowd interest is building before it reaches the scale that moves markets. The investors who learn to read these signals early consistently find themselves positioned before the FOMO wave arrives.
How to Track Social Volume Before It Goes Mainstream
Social volume refers to the total number of mentions a token receives across platforms like X, Reddit, Telegram, and Discord over a given time period. A token that is quietly seeing its social volume double over two or three weeks — while its price has not yet moved significantly — is showing early signs of organic interest building. This is the window before the crowd arrives.
LunarCrush is one of the most effective tools for tracking social volume and engagement across crypto assets. It aggregates data from multiple social platforms and scores tokens on metrics like social dominance, engagement rate, and galaxy score — a composite measure of social momentum relative to price. When a token’s LunarCrush galaxy score begins rising while its market cap remains low, that divergence is worth paying close attention to.
Tools That Measure Crypto Sentiment in Real Time
Beyond social volume, several tools measure the qualitative tone of crypto conversation — whether the sentiment is bullish, bearish, or neutral. Santiment tracks social sentiment alongside onchain data, allowing you to see whether rising social volume is accompanied by positive or negative sentiment shifts. The Crypto Fear and Greed Index, published daily by Alternative.me, gives a broader market-level read — extreme fear readings during periods of strong onchain fundamentals have historically represented some of the best altcoin accumulation windows available.
The Rotation Playbook: Where Capital Moves First
Altcoin season does not hit every token at once. Capital rotates through the market in a predictable sequence — and knowing where you are in that sequence is the difference between entering at the beginning of a move and chasing it at the top. The rotation follows market cap tiers and sector narratives, and once you recognize the pattern, you can anticipate each successive wave.
Large Cap Altcoins Move Before Small Caps
Ethereum almost always leads the altcoin rotation. When BTC dominance starts falling and total market cap is rising, ETH is typically the first major beneficiary. Its size, liquidity, and institutional familiarity make it the natural first stop for capital rotating out of Bitcoin. Ethereum’s price action relative to Bitcoin — tracked via the ETH/BTC pair — is one of the clearest signals that broad altcoin season conditions are developing.
After Ethereum, capital flows into other large-cap Layer 1 alternatives and established DeFi blue chips — assets like Solana (SOL), Avalanche (AVAX), Chainlink (LINK), and Uniswap (UNI). These are liquid enough to absorb significant capital flows while still delivering meaningful percentage gains. Institutional investors and larger funds who cannot buy small caps without moving the market are primarily active in this tier.
Only after the large caps have run significantly does capital begin flowing down into mid-cap and small-cap altcoins in meaningful volume. This is where the largest percentage gains are possible — but also where risk is highest. Small-cap tokens can deliver 10x to 50x returns during a full rotation, but they also carry the highest probability of going to zero if the rotation reverses before they catch a bid.
How Sector Rotation Works Across DeFi, L1s, Gaming, and Memes
Within each market cap tier, capital also rotates by sector. In a typical bull market, infrastructure and Layer 1 protocols move first as the foundational layer of the ecosystem. DeFi protocols follow as rising TVL attracts capital seeking yield. Then gaming and NFT-adjacent tokens activate as speculative appetite grows. Finally, memecoins capture the most speculative fringe capital at the very peak of market euphoria — making them useful as a sentiment indicator rather than a long-term investment category. When memecoins are dominating headlines and generating the largest percentage gains in the market, historically that has signaled that the cycle is entering its late stages.
Reading Volume Spikes Across Market Caps
Unusual volume is one of the earliest price-agnostic signals of incoming movement. A token that sees its 24-hour trading volume jump to 3x or 5x its 30-day average — without a corresponding price spike — suggests accumulation is happening quietly. Smart money is building positions without tipping their hand in price yet. Scanning for these volume anomalies daily using tools like CoinMarketCap’s gainers/losers and volume filters, or the advanced screener on TradingView, is one of the most actionable habits an altcoin investor can build.
Cross-reference volume spikes with onchain data to confirm whether the volume is coming from genuine spot buying or is being driven by derivatives activity. A volume spike backed by rising spot buy pressure and declining exchange reserves is significantly more bullish than one driven by futures open interest, which can reverse rapidly on a funding rate squeeze.
How to Avoid Altcoins That Look Good But Fail
For every altcoin that delivers life-changing gains, there are dozens that look compelling on the surface, gather retail attention, and then collapse — taking investors’ capital with them. The ability to filter out these traps is just as valuable as the ability to identify winners. Most losing altcoin positions share common warning signs that are visible before the price breaks down — if you know what to look for.
Red Flags in Tokenomics and Vesting Schedules
The most common tokenomics trap is a token with a low circulating supply at launch relative to its total supply. A token might launch with only 10% of its total supply in circulation, generating an artificially low market cap that looks cheap compared to competitors. But when the remaining 90% unlocks over the next 12 to 24 months — flowing primarily to team members, venture funds, and early private sale investors who bought at a fraction of current prices — the dilution can be catastrophic for holders who bought at launch prices. For more insights, you can explore this guide on crypto regulations to understand the broader market dynamics.
Always compare a token’s fully diluted valuation (FDV) to its current market cap. If the FDV is 10x or more the current market cap, that gap represents future token supply that will hit the market at current or lower prices. A token trading at a $100 million market cap with a $2 billion FDV means 95% of the supply has not yet entered circulation — and someone is holding it at a much lower cost basis than you are.
Hype-Driven Projects With No Product or Traction
A compelling whitepaper is not a product. A roadmap is not traction. Yet retail investors consistently pour capital into projects that have nothing more than a well-designed website, a vague vision for disrupting some multi-trillion dollar industry, and a token that launched before a single line of production code was deployed. These projects tend to pump hard on narrative alone — and collapse just as hard when the market realizes there is nothing underneath the marketing. For those interested in understanding the broader implications, exploring the differences between DeFi and traditional finance can provide valuable insights.
The simplest filter: does the protocol have a live mainnet product that real users are paying to use? Check DeFiLlama for TVL, Token Terminal for protocol revenue, and the project’s own documentation for evidence of actual product usage. If a project has been “in development” for more than 18 months with no mainnet launch, no beta users, and no fee revenue, the probability that it delivers meaningful returns — rather than a brief hype pump — drops dramatically. Promising teams miss deadlines. Teams that consistently miss deadlines while continuing to market aggressively are a different category of risk entirely.
The Tools Every Altcoin Hunter Should Bookmark
Having the right tools changes everything. Most retail investors are making decisions based on price charts and Twitter sentiment alone — and that information disadvantage is directly reflected in their results. The following set of tools covers every layer of the altcoin research process, from macro market signals down to individual token analysis.
Essential Altcoin Research Tools
TradingView (BTC.D chart): Track Bitcoin dominance and macro rotation signals in real time
Blockchaincenter.net: Monitor the Altcoin Season Index and 90-day altcoin vs. Bitcoin performance
DeFiLlama: Compare TVL, revenue, and protocol metrics across every major chain and DeFi project
Glassnode: Access deep onchain analytics including exchange flows, active addresses, and holder behavior
Nansen: Track smart money wallet activity and identify where sophisticated investors are accumulating
Token Terminal: Evaluate protocol fundamentals including revenue, P/S ratios, and developer activity
TokenUnlocks.app: Check vesting schedules and upcoming token unlock events before entering any position
LunarCrush: Measure social volume and sentiment trends across X, Reddit, and other platforms
CryptoQuant: Monitor exchange reserve data, stablecoin inflows, and funding rate signals
Bubblemaps: Visualize token holder concentration and detect connected wallet clusters
Artemis Terminal: Compare developer activity across protocols with a clean, aggregated interface
Dune Analytics: Access community-built onchain dashboards for virtually any protocol or metric
You do not need all of these tools every day. Build a routine: check BTC dominance and the Altcoin Season Index weekly, review stablecoin exchange inflows and the Fear and Greed Index a few times per week, and do deep-dive fundamental research on any token you are seriously considering using DeFiLlama, Token Terminal, and TokenUnlocks before you ever look at the price chart.
False Signals Will Cost You Money If You Ignore This
The biggest mistake altcoin investors make — even experienced ones — is acting on a single signal in isolation. One metric pointing in a bullish direction does not constitute a trade. The crypto market generates false signals constantly, and the cost of acting on them without confirmation is real. Building the discipline to wait for multiple signals to align before entering a position is what separates investors who survive multiple cycles from those who blow up chasing early entries that reverse violently.
Why Short Memecoin Spikes Are Not Altcoin Season
When memecoins start generating enormous percentage gains and dominating crypto news coverage, it can feel like altcoin season is in full swing. It usually is not. Short memecoin spikes driven by a single influencer, viral moment, or coordinated pump are not the same as the broad, sustained capital rotation that defines a genuine altcoin season. Memecoins move on pure sentiment and social momentum — they can go up 500% and come back down 90% in the same week, with no underlying fundamental change driving either move.
The distinction matters because chasing memecoin spikes at the wrong stage of the cycle is one of the fastest ways to lose capital. True altcoin season shows up as broad outperformance across multiple sectors simultaneously — DeFi tokens, Layer 1 alternatives, infrastructure protocols, and gaming tokens all moving together, driven by genuine liquidity rotation.
When only memecoins are running while blue-chip altcoins like Ethereum and Solana are lagging, that is a sentiment spike, not a season. Wait for the broader market to confirm before sizing up.
How to Stack Confirmations Before Entering a Position
Stacking confirmations means requiring multiple independent signals to align before committing capital. For altcoin entries specifically, a strong confirmation stack looks something like this: BTC dominance is declining on the weekly chart, the Altcoin Season Index is above 50 and rising, stablecoin exchange inflows have been increasing for at least two weeks, and the specific token you are evaluating shows rising active addresses, declining exchange reserves, and a clean tokenomics schedule with no major unlocks in the next 90 days. That is five independent signals pointing in the same direction — which is a materially different risk profile than buying because a token had a strong 24-hour candle.
Not every trade will have perfect confluence across every signal — and waiting for absolute certainty in crypto means missing most moves entirely. The practical target is three to four meaningful signals in alignment before entering. When macro market conditions, onchain fundamentals, and token-specific metrics all point bullish simultaneously, the probability of a profitable trade increases significantly. When they conflict — for example, strong onchain metrics but rising BTC dominance and falling stablecoin inflows — sizing down or waiting for resolution is the disciplined choice.
When to Hold Through Volatility and When to Exit
Altcoins are volatile by nature — 30% to 40% drawdowns during broader uptrends are common and do not automatically signal that a thesis has broken down. The key question is whether the fundamentals that drove your entry are still intact. If onchain activity is still growing, TVL is holding, developer commits are consistent, and the macro rotation signals are still pointing bullish, a price pullback is noise. If exchange inflows are spiking, whale wallets are distributing, and BTC dominance is reversing upward, those are thesis-breaking changes that warrant a reassessment — regardless of where the price sits relative to your entry. Define your exit criteria before you enter, not after the position starts moving against you.
Preparation Beats Prediction Every Time in Crypto
Nobody can predict exactly when altcoin season starts, which token will 10x first, or how long a rally lasts. The investors who consistently profit from altcoin cycles are not better at predicting — they are better at preparing. They build watchlists of fundamentally sound projects during quiet periods. They monitor onchain signals continuously so rotation signals are not surprises. They have position sizing rules in place before the market gets exciting. When the move finally comes, they are not scrambling to research — they are executing a plan they already made.
Think of altcoin investing as a two-phase process. The research and preparation phase happens during consolidation, when prices are boring and social sentiment is low. The execution phase happens during rotation, when you deploy prepared capital into pre-researched positions as signals confirm. Most retail investors do the opposite — they ignore the market during consolidation and scramble to research during the run, which is why they consistently buy late and sell early.
Altcoin Preparation Checklist — Build This Before the Market Moves
| Phase | Action | Timing |
|---|---|---|
| Macro Monitoring | Track BTC dominance trend weekly | Ongoing, every week |
| Watchlist Building | Identify 10 to 15 fundamentally sound tokens across 3 to 4 sectors | During market consolidation |
| Fundamental Review | Run tokenomics, GitHub, TVL, and team check on each watchlist token | Before rotation begins |
| Unlock Calendar | Flag any tokens with major unlocks in the next 90 days | Monthly review |
| Entry Planning | Set price levels or signal triggers for each watchlist position | Pre-rotation |
| Exit Planning | Define percentage gain targets and stop-loss levels in advance | Before any capital is deployed |
| Position Sizing | Allocate capital tiers based on market cap risk (large, mid, small) | Before rotation begins |
The investors who walk into altcoin season with a completed version of this checklist are playing a fundamentally different game than those who are still googling “best altcoins to buy” after the rally has already started. Preparation is not exciting — but profitability rarely is until you see the results.
Start building that watchlist now, during whatever period of relative calm the market is currently offering. The next rotation will come. The only question is whether you will be ready when it does.
Frequently Asked Questions
These are the questions that come up most often from investors who are serious about improving their altcoin research process — answered directly and without the noise.
What Is the Best Way to Find Altcoins Early?
The best way to find altcoins early is to combine onchain data monitoring with sector narrative research during market consolidation — not during rallies. Use DeFiLlama to identify protocols with rising TVL and low market caps relative to their usage. Use Nansen’s Smart Money tracker to watch which tokens sophisticated wallets are quietly accumulating. Cross-reference those findings with GitHub activity data from Token Terminal or Artemis to confirm genuine development is happening behind the scenes.
Community research also surfaces early opportunities that data tools sometimes miss. Engaging directly in governance forums on Commonwealth, reading project Discord channels for product update cadence, and following credible crypto researchers on X who share in-depth thread analysis can expose you to quality projects before they reach aggregator platforms. The goal is to be in the research funnel earlier than the average retail investor — which means doing the work when it is still boring to do so.
How Do I Know If an Altcoin Has Real Potential?
An altcoin has real potential when it demonstrates product-market fit through measurable usage, not just community hype. Look for growing protocol revenue on Token Terminal, rising TVL relative to market cap on DeFiLlama, consistent GitHub commit activity, transparent tokenomics with a clean unlock schedule, and a team with verifiable backgrounds and credible backers. When most of these factors align with a favorable macro rotation environment, you have a fundamentally grounded thesis rather than a speculative bet.
What Is the Altcoin Season Index and Where Can I Track It?
The Altcoin Season Index is a metric developed by Blockchaincenter.net that measures the percentage of the top 50 altcoins (by market cap) that have outperformed Bitcoin over the trailing 90 days. A reading above 75 is defined as altcoin season — meaning three-quarters or more of major altcoins are beating Bitcoin’s performance. A reading below 25 is defined as Bitcoin season, meaning Bitcoin is dominating returns across the market.
You can track it for free at Blockchaincenter.net under the “Altcoin Season Index” tool, which updates daily. Use it alongside the BTC.D chart on TradingView rather than in isolation — the two together give you a much clearer picture of where the market is in the rotation cycle than either metric provides on its own.
How Much of My Portfolio Should Be in Altcoins?
There is no universal answer, but a practical framework is to size altcoin exposure based on where the market is in the cycle and your personal risk tolerance. During Bitcoin season — when BTC dominance is rising and altcoins are generally underperforming — a heavier allocation toward Bitcoin and stablecoins (60% to 80% of crypto holdings) preserves capital and reduces drawdown risk. As rotation signals build and altcoin season approaches, gradually shifting 30% to 50% of holdings into a diversified altcoin portfolio across large, mid, and small caps becomes appropriate.
Within your altcoin allocation, risk-tiering by market cap makes sense. Large-cap altcoins like Ethereum and Solana should represent the largest share of your altcoin book — they are most liquid, least likely to go to zero, and still capable of delivering 3x to 5x returns in a full bull cycle. Mid-caps offer higher upside with moderate risk. Small-caps and micro-caps should represent your smallest allocation — sized so that a complete loss of any single position does not materially damage your overall portfolio.
Position sizing discipline is more important than picking the right tokens. A correct token call that is over-leveraged or over-concentrated can still destroy a portfolio if the timing is off by a few weeks. Size each position so you can hold through volatility without being forced out by emotional or financial pressure.
Sample Altcoin Portfolio Allocation Framework by Cycle Phase
| Cycle Phase | Bitcoin & Stables | Large-Cap Altcoins | Mid-Cap Altcoins | Small-Cap Altcoins |
|---|---|---|---|---|
| Bitcoin Season (BTC.D rising) | 75% | 15% | 7% | 3% |
| Early Rotation (BTC.D declining) | 50% | 30% | 15% | 5% |
| Altcoin Season (Index above 75) | 25% | 35% | 25% | 15% |
| Late Cycle (Memecoins dominating) | 50% | 30% | 15% | 5% |
Can You Still Make Money Buying Altcoins After a Rally Starts?
Yes — but the risk profile changes significantly depending on where you enter within the rotation sequence. Buying large-cap altcoins like Ethereum or Solana after BTC dominance has already been declining for several weeks still offers meaningful upside if the rotation is only in its early stages. The large caps typically run for weeks before mid-caps and small-caps follow, meaning latecomers to the large-cap move can often rotate profits into earlier-stage mid-cap and small-cap positions with stronger remaining upside.
The mistake is entering at the same level of risk late in the rotation that you would have used early. If memecoins are already dominating headlines, social volume across every major token is at multi-month highs, and the Fear and Greed Index is sitting in extreme greed territory, the risk of buying aggressive small-cap positions at that stage is substantially higher than it was two months earlier when those same signals were quiet. Late-cycle entries require tighter position sizing, stricter exit planning, and a much shorter intended holding period.
Buying an already-running altcoin can still be profitable if the macro environment supports further rotation, the token’s fundamentals are genuinely strong, and your entry is sized appropriately for the increased risk. What it cannot be is a full-sized, long-term conviction position entered at the exact moment when retail FOMO is at its peak — that specific combination of behaviors is precisely how most retail investors end up holding altcoins through a 70% to 90% drawdown wondering what went wrong. For a broader comparison, you might want to explore the NFT vs DeFi investment strategies to diversify your portfolio.
The best approach if you have missed the early entry: wait for the first significant pullback after the initial pump, confirm that onchain fundamentals are still intact, and enter at a reduced size relative to what you would have committed earlier in the cycle. Patience is not a passive strategy in crypto — it is one of the highest-return skills you can develop.
DISCLAIMER: This article is for informational purposes only and does not constitute financial, investment, or legal advice. Altcoin investing involves various risks including market volatility, liquidity risk, smart contract vulnerabilities, regulatory changes, and total loss of capital. Always conduct your own research (DYOR), verify all information independently, consult with qualified financial professionals, and never invest more than you can afford to lose. Past performance does not guarantee future results. The information presented reflects conditions as of 2026 and may become outdated as markets, technologies, and regulations evolve.


Latest
Altcoins
13 May 2026
Altcoins
15 Mar 2026
Altcoins
25 Feb 2026
Altcoins
21 Feb 2026