Coinposters
Crypto Market Report Week of July 27, 2026 – Bitcoin Holds Steady Near $65k
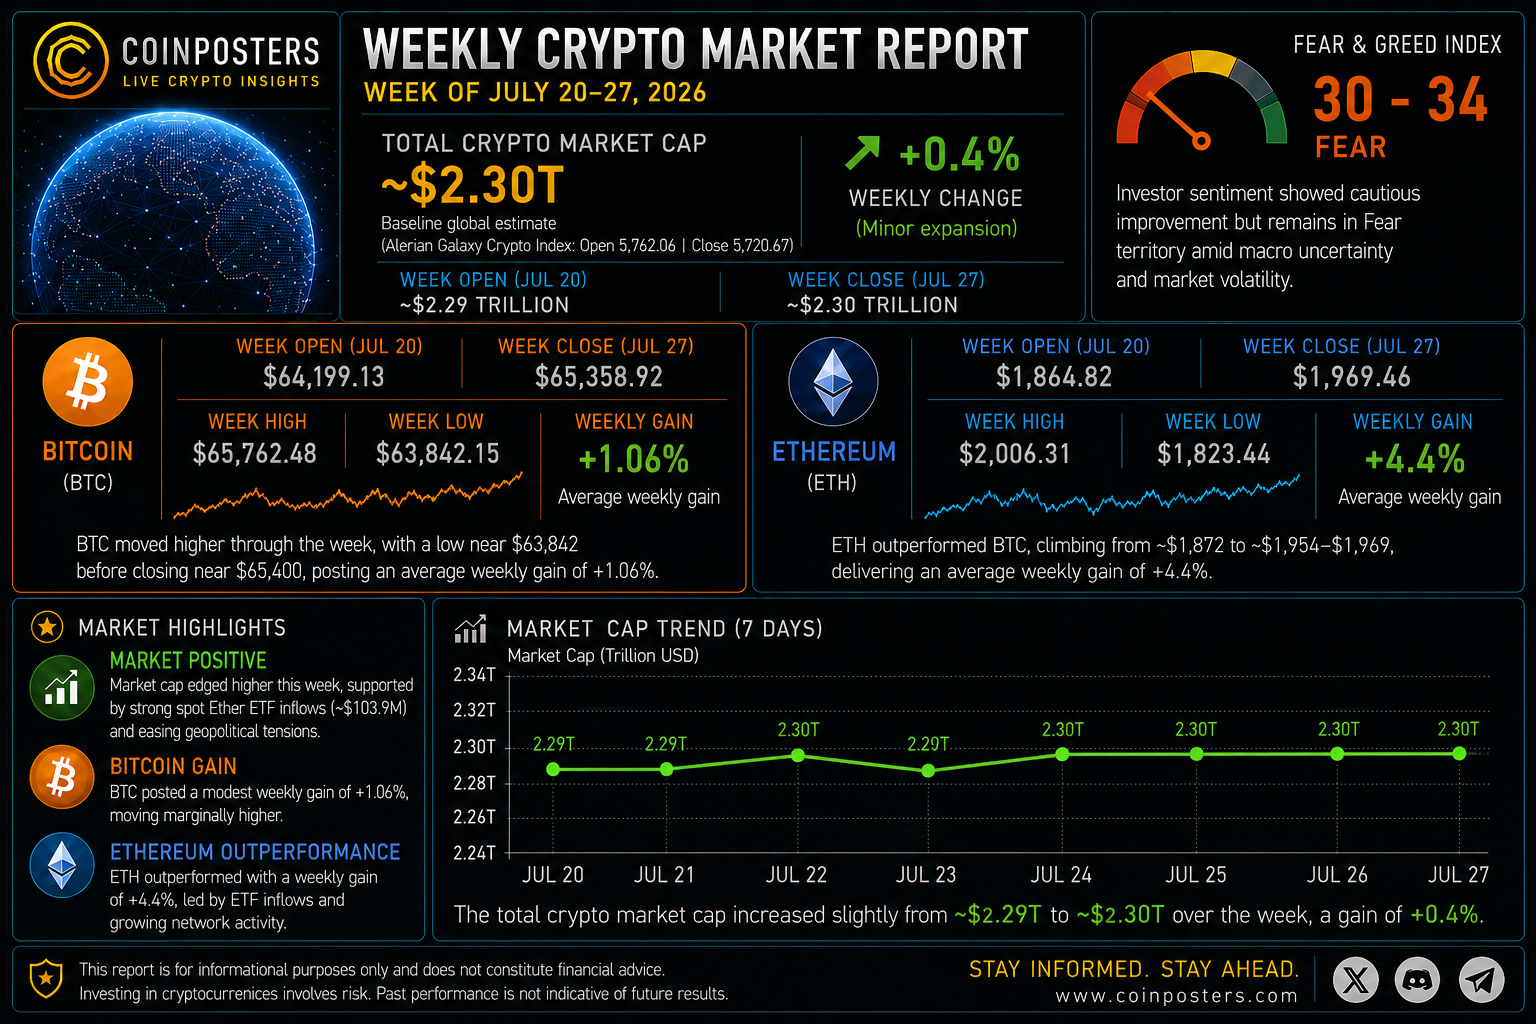
This week’s crypto market report shows Bitcoin and Ethereum both closing modestly higher even as altcoins broadly bled and traditional equity markets sold off hard, a divergence that says more about where capital is hiding than the headline numbers alone suggest.
Article At A Glance
- Bitcoin is holding near $65,400 with the global crypto market cap sitting at $2.26 trillion, but the lack of altcoin rotation tells a bigger story about where capital is actually going.
- Bitcoin dominance at 56-57% is one of the clearest signals that we are not in altcoin season yet, with XRP bleeding 6.2% on the week as the hardest-hit major.
- Ethereum quietly outperformed again this week, moving from $1,872 to $1,954, its second consecutive week of relative strength against BTC, a pattern worth watching closely.
- Crypto held its ground while traditional markets crumbled, the Nasdaq fell 2.1%, the Magnificent Seven lost $790 billion in a single session, and the 10-year Treasury jumped 20 basis points.
- 2026 is shaping up as a year of market attrition, major exchanges including BitMEX, BitMart, and AscendEx have announced wind-downs, and several high-profile DeFi protocols have gone dark.
Table of Contents
- Bitcoin Holds Near $65K While Altcoins Bleed
- Weekly Price Performance Across Major Assets
- Crypto Outperforms Traditional Markets Despite Altcoin Weakness
- What On-Chain Data Tells Us Right Now
- 2026 Has Been a Year of Market Attrition
- Institutional Moves Still Shaping the Market
- DOGE Setup: Simple But Conditional
- What to Watch in the Week Ahead
- Frequently Asked Questions
The crypto market this week delivered exactly what seasoned participants have learned to expect from a consolidation regime: just enough movement to keep hope alive, not enough to confirm a breakout.
For anyone tracking these markets daily, staying plugged into real-time crypto intelligence is not optional, it is the difference between reacting and positioning. Here is the full breakdown of everything that mattered this week in this crypto market report.
Bitcoin Holds Near $65K While Altcoins Bleed
Bitcoin opened the week at $64,722 and closed at approximately $65,400, a grind higher that looked more like a controlled drift than a rally. Price action stalled near $66,700 before retracing toward $64,000, then recovering to settle around $65,100 by Friday. That pattern, a local push followed by a fade and a soft recovery, has defined Bitcoin’s behavior for most of July 2026.
Global Crypto Market Cap Sits at $2.26 Trillion
According to CoinGecko, the total crypto market capitalization came in near $2.26 trillion this week. That number sounds large, but context matters. Bitcoin alone accounts for 56% of that figure, which means the remaining $990 billion or so is spread across thousands of altcoins, many of which are quietly losing ground while BTC holds steady.
Bitcoin Dominance at 57% Signals No Altcoin Season Yet
Bitcoin dominance hovering between 56% and 57% is not a neutral data point. Historically, altcoin seasons tend to ignite when dominance breaks decisively below 50%, signaling that capital is rotating outward from BTC into higher-risk plays. That rotation simply has not happened yet. The money is staying close to Bitcoin, either sitting in BTC directly or parked in stablecoins waiting for the next decisive move.
The uneven weekly performance across major altcoins reinforces this picture. XRP dropped 6.2%, BNB fell 1.6%, and even Solana, one of the stronger performers in recent months, could not fully escape the week’s selling pressure. When altcoins are losing ground while Bitcoin barely moves, it is a sign that risk appetite has not fully returned to the market.
ETH Outperforms in 2026 With 40% Year-to-Date Gains
Ethereum has been the quiet story of this week, and arguably of the broader 2026 market. ETH moved from $1,872 to $1,954 during the week, a clean 4.4% gain while most of the altcoin market was in the red. More importantly, ETH/BTC lifted for a second consecutive week, a relative strength signal that deserves attention. When ETH starts outperforming Bitcoin on a sustained basis, it has historically been an early indicator that broader market risk appetite is warming up, even before it shows up in altcoin prices.
Weekly Price Performance Across Major Assets
Numbers this week told a story of a market that mostly held up at the top while cracking underneath. Bitcoin’s modest 1.0% weekly gain and Ethereum’s 4.4% gain stood in sharp contrast to the damage seen across altcoins, where the directional move was overwhelmingly down. There were no standout breakout performers among the top ten by market cap, which reinforces the view that this is a market in consolidation rather than one building toward a near-term move higher. For those looking to understand common pitfalls, exploring the biggest crypto trading mistakes might provide valuable insights.
| Asset | Weekly Change | Approximate Price (USD) |
|---|---|---|
| Bitcoin (BTC) | +1.0% | $65,400 |
| Ethereum (ETH) | +4.4% | $1,954 |
| XRP | -6.2% | N/A |
| BNB | -1.6% | N/A |
| Solana (SOL) | Relatively Flat | N/A |
| TRON (TRX) | Comparatively Stable | N/A |
Bitcoin Up 1.0%, Ethereum Up 4.4% on the Week
Bitcoin’s modest weekly gain of 1.0% is not a headline on its own. What gives it weight is the context, thin spot volumes, ETF outflows during parts of the week, and softer on-chain activity all paint the picture of a market that lacks a near-term catalyst despite the small gain. Ethereum’s 4.4% gain is more notable, and given its intraweek move from $1,872 to $1,954, the weekly close number actually reflects genuine relative strength compared to everything else in the market this week.
XRP Takes the Hardest Hit at -6.2%
XRP’s 6.2% weekly decline was the worst performance among the major assets tracked this week. That kind of underperformance in a consolidating market usually reflects one of two things: either a specific catalyst hitting the asset, or simply the market pricing out speculative premium that had built up during a previous run. Without a clear news driver, XRP’s drop looks more like the latter, a deflation of positioning rather than a fundamental shift in outlook.
Solana and TRON Hold Relatively Steady
Solana’s relative resilience this week is worth noting. While it was not immune to selling pressure, it held up better than XRP and BNB, which is consistent with the narrative that Solana’s ecosystem, particularly its DeFi and NFT activity, continues to attract developer and user interest even in quieter market conditions. TRON’s stability is a different kind of story, largely driven by its stablecoin volume rather than speculative demand.
Crypto Outperforms Traditional Markets Despite Altcoin Weakness
Here is the part of the weekly picture that rarely gets enough attention: crypto, despite altcoin weakness, held up significantly better than traditional financial markets this week. That relative outperformance matters, because it speaks to where institutional and retail capital is finding relative safety, and increasingly, it is not in equities.
Bitcoin and Ethereum’s modest gains this week look very different when you set them next to a Nasdaq that fell 2.1% in a single session and a tech sector that lost nearly $800 billion in market cap in one day. The broader crypto market, weighed down by altcoin weakness, did not fully escape the macro pressure, but Bitcoin and Ethereum specifically pushed through it and closed the week higher.
Nasdaq Falls 2.1% as Magnificent Seven Loses $790 Billion in One Session
The Magnificent Seven, the cluster of mega-cap tech stocks including Apple, Microsoft, Nvidia, Alphabet, Amazon, Meta, and Tesla, shed approximately $790 billion in a single trading session this week. That kind of single-session destruction in what are considered the safest large-cap equities is a signal that investors are repricing risk across asset classes, not just in crypto. The Nasdaq’s 2.1% weekly decline reflects a broader unwind of AI-driven valuations that had pushed tech multiples to historically stretched levels.
Interestingly, some of that capital appears to be finding its way into Bitcoin. The narrative of BTC as a macro hedge has been gaining traction among institutional desks, and weeks like this, where equities sell off hard while Bitcoin holds a range and edges higher, tend to reinforce that narrative with real data rather than theory.
10-Year Treasury Jumps 20 Basis Points to a 19-Month High
A 20 basis point jump in the 10-year Treasury yield in a single week is a significant move. At a 19-month high, the 10-year is sending a message about inflation expectations, fiscal concerns, or both. Rising yields typically pressure risk assets, which makes Bitcoin’s ability to hold and even gain slightly this week even more notable. When the traditional safe-haven (long-duration Treasuries) is selling off at the same time as equities, capital needs somewhere to go. Some of it, based on on-chain flow data, is moving toward BTC.
Brent Crude Breaks $100 as Macro Pressure Builds
Brent crude crossing the $100 per barrel threshold this week added another layer of complexity to an already stressed macro environment. Energy prices at this level feed directly into inflation expectations, which in turn pressure central banks to maintain or extend restrictive monetary policy. For crypto markets, that means the tailwind of anticipated rate cuts, which had been a significant driver of bullish sentiment in late 2025, is getting pushed further out on the timeline. Understanding the impact of such macroeconomic factors is crucial for crypto risk management strategies in 2026.
The combination of rising oil, a spiking 10-year yield, and a collapsing equity session creates the kind of macro backdrop that historically shakes out weak hands across all risk assets. The fact that Bitcoin absorbed this week’s macro shock and still closed higher without breaking below $64,000 is, by itself, a data point worth holding onto as we move into August.
What On-Chain Data Tells Us Right Now
Spot prices only tell part of the story. The on-chain data this week is carrying signals that are arguably more important than the weekly price moves themselves, and the picture they paint is one of a market that is coiling rather than collapsing.
Short-Term Holder Cost Basis Is the Key Level to Watch
The short-term holder cost basis, the average price at which coins held for fewer than 155 days were last moved, is sitting just below current spot prices. This level acts as a psychological and mechanical support zone. When Bitcoin trades above the short-term holder cost basis, recent buyers are in profit and less likely to sell. When it trades below, those same holders become a source of selling pressure as they look to exit at breakeven.
Right now, Bitcoin hovering just above that cost basis is one of the more constructive signals in the on-chain data set. It suggests that the cohort most likely to sell, recent buyers who bought near the top, has not yet been pushed into a loss position severe enough to trigger capitulation. That does not guarantee upside, but it does reduce the probability of a disorderly breakdown from current levels.
Shorts Have Folded and ETF Flows Have Flipped Positive
Leveraged short positioning, which had been building through much of July, was largely flushed out during Bitcoin’s push toward $66,700 earlier in the week. The clearing of that short overhang removes a mechanical source of upward pressure, short squeezes, but it also means the market is no longer carrying the kind of negative skew that tends to amplify downside moves. Meanwhile, Bitcoin spot ETF flows, which had logged seven consecutive sessions of inflows before turning negative mid-week, ended the period in a net positive position. Institutional demand through the ETF wrapper remains inconsistent but present. For those looking to refine their strategies, understanding crypto risk management rules is crucial.
Spot Volume at Its Lowest Since 2019
This is the data point that should give every bull pause. Spot trading volume across major exchanges has fallen to levels not seen since 2019, according to on-chain and exchange data. Low volume in a consolidating market can be read two ways: either participants are waiting for a catalyst before committing capital, or the market has simply lost the retail participation that drives explosive moves.
The 2019 analog is worth taking seriously. That year, Bitcoin ran from roughly $3,500 to $14,000 before volume dried up and price consolidated for months. The structural parallel is not exact, but the volume signature, thin, unengaged, low-conviction trading, is consistent with a market that has not yet found its next narrative strong enough to pull fresh capital off the sidelines.
Exchange Flows Are Quiet as the Offer Side Thins Out
Exchange inflows and outflows, the movement of Bitcoin onto and off trading platforms, have been unusually quiet this week. Low exchange inflows typically signal that holders are not preparing to sell, which reduces the available supply on the offer side. When sell-side liquidity thins out while demand stays even modestly consistent, the setup for a sharp upside move improves simply because there are fewer coins available at current prices.
On-Chain Signal Summary, Week of July 27, 2026
🟢 Short-Term Holder Cost Basis: Holding just below spot, constructive
🟡 Leveraged Shorts: Largely cleared, neutral to slightly positive
🟡 ETF Flows: Net positive for the week, inconsistent but present
🔴 Spot Volume: Lowest since 2019, warrants caution
🟢 Exchange Inflows: Suppressed, offer side thinning out
The collective read from these signals is not a screaming buy. It is something more nuanced: a market that is compressing under low conviction, where the conditions for a sharp move are slowly being assembled, but where the actual trigger has not yet appeared.
Dormant Bitcoin movement also fell to a four-year low this week, meaning long-term holders are not moving their coins. That kind of supply lock-up, combined with thin exchange flows, means that any meaningful demand catalyst could move price more aggressively than the current range suggests.
2026 Has Been a Year of Market Attrition
Beyond the weekly price action, the structural story of 2026 in crypto is one of consolidation, not just in price, but in the industry itself. The businesses, protocols, and platforms that could not survive thin margins and reduced volumes are now being winnowed out, and the pace of that winnowing has accelerated sharply this year. For those seeking to adapt, exploring passive crypto income strategies like staking and yield farming might offer some respite.
BitMEX, BitMart, and AscendEx All Announce Wind-Downs
Three centralized exchanges, BitMEX, BitMart, and AscendEx, have all announced wind-downs in 2026. BitMEX, once the dominant force in Bitcoin derivatives trading with peak volumes that shaped the entire market, is shutting down after years of regulatory pressure, reputational damage following its founders’ legal battles, and an inability to compete with the next generation of derivatives platforms. BitMart and AscendEx, both mid-tier spot exchanges that had carved out niches during the 2020-2021 bull market, could not survive the combination of fee compression and volume migration to larger platforms.
DeFi Casualties Include Zapper, Radiant, Goldfinch, and More
The decentralized finance sector has not been spared. Zapper, the DeFi portfolio management interface that became a staple tool for on-chain users during the last bull cycle, went dark in 2026 as fee revenue collapsed and the team could no longer sustain operations. Radiant Capital, the cross-chain lending protocol that suffered a devastating exploit in late 2024, formally wound down after failing to rebuild user trust and TVL. Goldfinch, the real-world asset lending protocol that had positioned itself as a bridge between DeFi and emerging market credit, also ceased operations after persistent loan defaults and a shrinking investor base.
These are not obscure projects. These were protocols with real user bases, venture backing, and genuine product-market fit at their peaks. Their failures in 2026 reflect something important: the DeFi revenue model, which depends heavily on transaction fees and yield arbitrage, is brutally exposed when market activity drops and yields compress. The protocols that survive this period will be those with diversified revenue, strong communities, or a genuine monopoly on a specific on-chain function.
Fee Compression and Thin Volumes Have Made Mid-Market Unviable
The underlying economics driving these closures are straightforward. Trading fees across both centralized and decentralized platforms have been compressed to near zero as competition intensified over the past three years. Binance, Coinbase, and Kraken have the scale to operate on razor-thin margins. Mid-tier platforms do not, often leading to biggest trading mistakes for beginners trying to navigate these changes.
On the DeFi side, the launch of Ethereum’s layer-2 ecosystem, Arbitrum, Base, Optimism, and others, dramatically reduced gas fees, which sounds like a win for users but simultaneously destroyed the fee revenue that funded many DeFi protocol treasuries. Protocols that had built their financial models around Ethereum mainnet fee capture found themselves structurally underfunded almost overnight.
What this attrition ultimately means for the market is a flight to quality and a narrowing of the competitive landscape. Fewer platforms competing for the same user base means the survivors, the Binances, the Uniswaps, the Aaves, capture a larger share of activity. That concentration of volume and liquidity into fewer venues is already visible in the on-chain data, and it will likely shape the structure of the next bull market more than most analysts are currently pricing in.
Institutional Moves Still Shaping the Market
Despite the turbulence at the retail and mid-market level, institutional engagement with crypto has not retreated in 2026, it has become more selective. The money is still moving, but it is moving with greater precision, targeting specific assets and specific infrastructure plays rather than making broad-based bets on the sector.
Bitcoin remains the primary institutional vehicle, and the spot ETF structure introduced in the United States has made BTC more accessible than ever to traditional allocators. The weekly flow data from Bitcoin ETFs, even with its inconsistency, reflects genuine institutional demand that did not exist in the same form during previous cycles. This structural demand floor is one of the reasons Bitcoin has held its range despite the macro headwinds of 2026.
Citadel Securities Backs Crypto.com Despite Uneven ETF Flows
One of the more significant institutional signals of the week came from Citadel Securities, which disclosed backing for Crypto.com amid the broader industry consolidation. Citadel’s involvement is not a casual endorsement, the firm is one of the most sophisticated market-making operations in global finance, and its decision to back a specific crypto platform in an environment where three exchanges just announced wind-downs speaks directly to where institutional capital sees long-term viability. The move also signals that the market structure layer of crypto, the plumbing of liquidity provision and exchange infrastructure, remains attractive to serious institutional players even as retail-facing businesses struggle.
Capital Rotating Out of AI Valuations Is Finding Its Way Into BTC
The Magnificent Seven’s single-session loss of $790 billion did not evaporate, it had to go somewhere. A measurable portion of that capital rotation appears to be finding its way into Bitcoin, which held its range and edged higher during the same week that growth equities were getting dismantled. This is not a coincidence. The narrative of Bitcoin as a macro diversifier, an asset uncorrelated to tech equity valuations, is being stress-tested in real time in 2026, and so far, BTC is passing that test.
Institutional desks that have been overweight AI-driven tech names are now sitting on compressed multiples and rising volatility. Bitcoin, by contrast, offers a completely different risk profile: fixed supply, 24/7 liquidity, no earnings risk, and no exposure to AI capex cycles. As the AI trade deflates, the structural case for a BTC allocation gets stronger by comparison, and the ETF wrapper makes that reallocation easier to execute than at any previous point in crypto’s history.
DOGE Setup: Simple But Conditional
Dogecoin is this week’s featured asset in the token spotlight, and the setup it is presenting is genuinely straightforward, which is both its appeal and its limitation. DOGE has always been a sentiment-driven asset, moving on social momentum and influencer attention rather than on-chain fundamentals or protocol development. That has not changed in 2026. What has changed is the technical structure the price is currently sitting on, which is worth understanding clearly before positioning around it.
DOGE declined along with the broader altcoin market this week, underperforming most major assets. The weekly chart shows a pattern of lower highs since the local peak earlier in 2026, with price compressing toward a support zone that has held through multiple tests. The question is not whether DOGE is fundamentally undervalued, it is whether the technical setup provides a risk-defined entry for traders who want exposure to a sentiment bounce.
There are two levels that define the entire trade this week. Everything else is noise. Either the support holds and the recovery path opens up, or it breaks and the thesis resets entirely. Here is how to read both scenarios:
- Support zone: $0.068-$0.069, this is the level that keeps the recovery thesis alive. Multiple weekly closes above this range indicate that buyers are defending the floor. A clean break below it on meaningful volume would invalidate the near-term long case.
- Resistance target: $0.078-$0.080, this is the first real test for any recovery move. Clearing this zone with conviction opens the path toward the $0.102-$0.105 range, where the previous supply cluster sits.
- Extended target: $0.102-$0.105, reached only if broader market sentiment improves and DOGE captures social momentum again. This level represents roughly 50% upside from current support and requires a catalyst beyond technicals alone.
- Invalidation: A close below $0.068, if DOGE loses the $0.068 level on a daily close, the setup is off the table and the next meaningful support does not appear until the $0.055-$0.058 range.
$0.068-$0.069 Is the Support Level That Keeps Recovery Alive
The $0.068-$0.069 support zone has been tested three times in the past six weeks and has held each time. That kind of repeated defense of a level is not accidental, it reflects genuine buy-side interest at those prices, whether from longer-term DOGE holders averaging down or from traders who have identified the technical significance of the zone. Each successful test also slightly weakens the level, because the buyers who stepped in at those prices are now holding coins with a cost basis right at support. If price returns a fourth time, fewer fresh buyers are waiting.
This is why the support level is conditional rather than guaranteed. The setup is constructive as long as DOGE holds above $0.068 on a closing basis. Below that, the mechanical support from prior buyers evaporates quickly, and the next level of meaningful demand is significantly lower. Trade accordingly, defined risk entries near support with a hard stop on a daily close below $0.068 represent the cleanest expression of this thesis.
A Break Above $0.078-$0.080 Opens the Path to $0.102-$0.105
The $0.078-$0.080 band is where the real test begins. This zone represents the convergence of the previous breakdown level and the 50-day moving average on the daily chart, making it a technically significant area where sellers are likely to reassert. A clean break above $0.080 on above-average volume would flip that resistance into support and significantly increase the probability of a run toward $0.102-$0.105, but that move requires either a broad market catalyst or a DOGE-specific social trigger, neither of which is visible on the immediate horizon.
What to Watch in the Week Ahead
The week ahead is not short on potential catalysts. Macro data releases, regulatory developments, and on-chain inflection points are all queued up, and any one of them could be the trigger that breaks Bitcoin out of its current range, in either direction. The key is knowing which signals actually matter and which are noise.
Bitcoin’s price behavior around the $64,000 level is the single most important thing to monitor. That level represents the convergence of the short-term holder cost basis and the lower bound of the current consolidation range. A clean hold above $64,000 on any macro-driven dip keeps the constructive thesis intact. A break below it, particularly on high volume, would represent the first serious technical damage to the range and could accelerate selling toward the $60,000-$61,000 support cluster.
On the institutional side, the weekly Bitcoin ETF flow data will be closely watched. After Bitcoin ETFs ended a seven-session inflow streak mid-week before recovering to net positive, the market is watching to see whether institutional demand re-engages or continues to be inconsistent. A strong inflow week would provide real demand confirmation that supports the range-hold thesis.
- Bitcoin $64,000 level, the line in the sand for the consolidation thesis. Watch daily closes, not intraday wicks.
- Bitcoin ETF weekly flows, net inflow confirmation would be the clearest institutional demand signal available.
- ETH/BTC ratio, a third consecutive week of ETH outperformance would significantly strengthen the case for an early altcoin rotation setup.
- 10-year Treasury yield, if the yield continues to climb from its 19-month high, risk assets including crypto face continued headwinds. A reversal would be broadly supportive.
- Brent crude and CPI expectations, energy prices above $100 feed inflation expectations. Watch for any central bank commentary that shifts rate cut timelines.
- DOGE $0.068 support, a fourth test of this level will be the moment of truth for the near-term recovery thesis.
- Exchange consolidation news, with three major platforms already announcing wind-downs, further consolidation announcements could trigger short-term sentiment shifts across the sector.
Frequently Asked Questions
The questions coming in most frequently this week reflect a market trying to make sense of contradictory signals, macro stress, crypto resilience, industry consolidation, and specific asset setups all happening simultaneously. Here are the clearest answers to what is being asked most.
Why Is Bitcoin Dominance So High at 57% Right Now?
Bitcoin dominance at 56-57% reflects a market where capital is gravitating toward the lowest-risk crypto asset rather than spreading into the broader altcoin market. In uncertain macro environments, rising yields, equity volatility, oil above $100, investors tend to concentrate in Bitcoin because it has the deepest liquidity, the most established institutional infrastructure through the spot ETF market, and the clearest regulatory status. Altcoins, which carry more idiosyncratic risk and lower liquidity, get de-prioritized when macro conditions create uncertainty. Dominance will likely stay elevated until either a clear macro tailwind emerges for risk assets broadly, or a specific altcoin narrative, like a major protocol upgrade or a new use-case breakout, pulls capital away from BTC specifically.
What Does the Short-Term Holder Cost Basis Mean for Bitcoin’s Price?
The short-term holder cost basis is the average acquisition price of Bitcoin held by wallets that have moved their coins within the last 155 days. It matters because this cohort represents the portion of the market most likely to sell, they bought relatively recently and are more sensitive to price fluctuations than long-term holders who have been accumulating for years.
When Bitcoin trades above the short-term holder cost basis, recent buyers are in profit and have less incentive to sell at a loss. The market is in a healthier state. When Bitcoin trades below that level, those same holders are underwater and selling pressure increases as they seek to exit near breakeven. Right now, with Bitcoin just above that cost basis, the market is in a zone where short-term holder behavior is relatively neutral, neither a forced selling environment nor a euphoric profit-taking environment. That neutrality is actually one of the reasons the consolidation has been so orderly.
Is the Crypto Market in a Bear Market in 2026?
- Total market cap: $2.26 trillion, significantly above the sub-$1 trillion levels seen during the 2022 bear market bottom.
- Bitcoin price: $65,400, well above both the 2022 low of approximately $15,500 and the pre-2024-halving range.
- Institutional participation: Active and growing through the ETF structure, which did not exist during the last bear market.
- Industry health: Mixed, exchange and DeFi consolidation is real, but it reflects fee compression and competition, not systemic collapse.
The technical answer is no, the crypto market is not in a bear market by conventional definition in 2026. A bear market typically involves a sustained decline of 20% or more from a recent peak, combined with deteriorating fundamental conditions. Bitcoin at $65,400 is not in that territory, and the total market cap at $2.26 trillion reflects a market that is consolidating at elevated levels rather than unwinding from them. For those interested in the nuances of crypto trading, understanding crypto risk management rules is crucial for active traders.
What 2026 does represent is a period of market maturation under stress. The industry is shedding its weaker participants, exchanges with unsustainable economics, DeFi protocols that depended on high-fee environments, and projects that never developed real user demand beyond speculative interest. That process is uncomfortable and creates negative headlines, but it is structurally healthy for the long-term development of the asset class.
The more precise description for current conditions is a high-level consolidation with sector-specific attrition. The macro environment is creating headwinds, volume is thin, and the altcoin market is underperforming significantly relative to Bitcoin. But the structural supports, institutional ETF demand, a fixed Bitcoin supply schedule, growing regulatory clarity, and deepening global adoption, remain intact. The market is not collapsing. It is waiting.
Why Are So Many Crypto Exchanges and DeFi Protocols Shutting Down in 2026?
The closures of BitMEX, BitMart, AscendEx, Zapper, Radiant Capital, and Goldfinch all trace back to the same root cause: the business models that sustained these platforms during the 2020-2021 bull market, high trading volumes, elevated fees, and abundant speculative capital, no longer exist in the same form. Fee compression driven by hyper-competition among centralized exchanges, combined with the shift of DeFi activity to low-cost layer-2 networks that eliminated the mainnet fee revenue that funded protocol treasuries, made the unit economics unworkable for any platform without either massive scale or a genuine competitive moat. The platforms shutting down in 2026 are not outliers, they are the predictable casualties of a market that has professionalized and consolidated around fewer, stronger competitors.
How Did Crypto Hold Up Better Than Stocks This Week?
Bitcoin’s modest 1.0% weekly gain might look unremarkable in isolation. Against a week where the Nasdaq fell 2.1% in a single session, the Magnificent Seven lost $790 billion in one day, and the 10-year Treasury spiked 20 basis points to a 19-month high, Bitcoin’s ability to close the week higher, rather than merely flat, represents genuine relative strength.
The reason comes down to the nature of what each asset class is pricing. Equities, particularly high-multiple tech stocks, are pricing in future earnings growth that is now being called into question by rising rates and slowing AI monetization timelines. Bitcoin is not pricing in earnings. It is pricing in scarcity, liquidity, and its role as a non-sovereign store of value. In a week where the risk to earnings-dependent assets was very high, Bitcoin’s lack of earnings dependence became an advantage.
The ETF structure also played a role. Institutional investors who want to reduce equity exposure but maintain market risk can now allocate to Bitcoin through a familiar wrapper, a spot ETF, without the friction of self-custody or exchange risk. That optionality creates a demand floor that did not exist in previous macro stress events, and it is increasingly visible in Bitcoin’s behavior during weeks like this one.
Finally, the on-chain data supports the relative resilience narrative. Exchange inflows were suppressed, long-term holders did not move their coins, dormant Bitcoin movement fell to a four-year low, and short-side leverage was cleared out earlier in the week. A market where holders are not selling, shorts have been flushed, and institutional demand is showing up through ETFs is structurally better positioned to absorb macro shocks than one where all three of those conditions are working in the opposite direction. That is exactly the setup Bitcoin presented this week, and it showed in the price action.
DYOR Disclaimer: This article is for informational and educational purposes only and does not constitute financial or investment advice. Prices, percentages, and market data reflect conditions at the time of writing and can change rapidly. Cryptocurrency markets are volatile and carry risk of loss. Always do your own research (DYOR) and consult a qualified financial advisor before making investment decisions.





Latest
Market Brief
08 Jul 2026
Market Brief
04 Jul 2026
Market Brief
21 May 2026
Market Brief
13 May 2026
Market Brief
28 Apr 2026
Market Brief
15 Mar 2026