Coinposters
Crypto Market Report July 6, 2026: Strong Relief Rally Sparks Hopes For Recovery
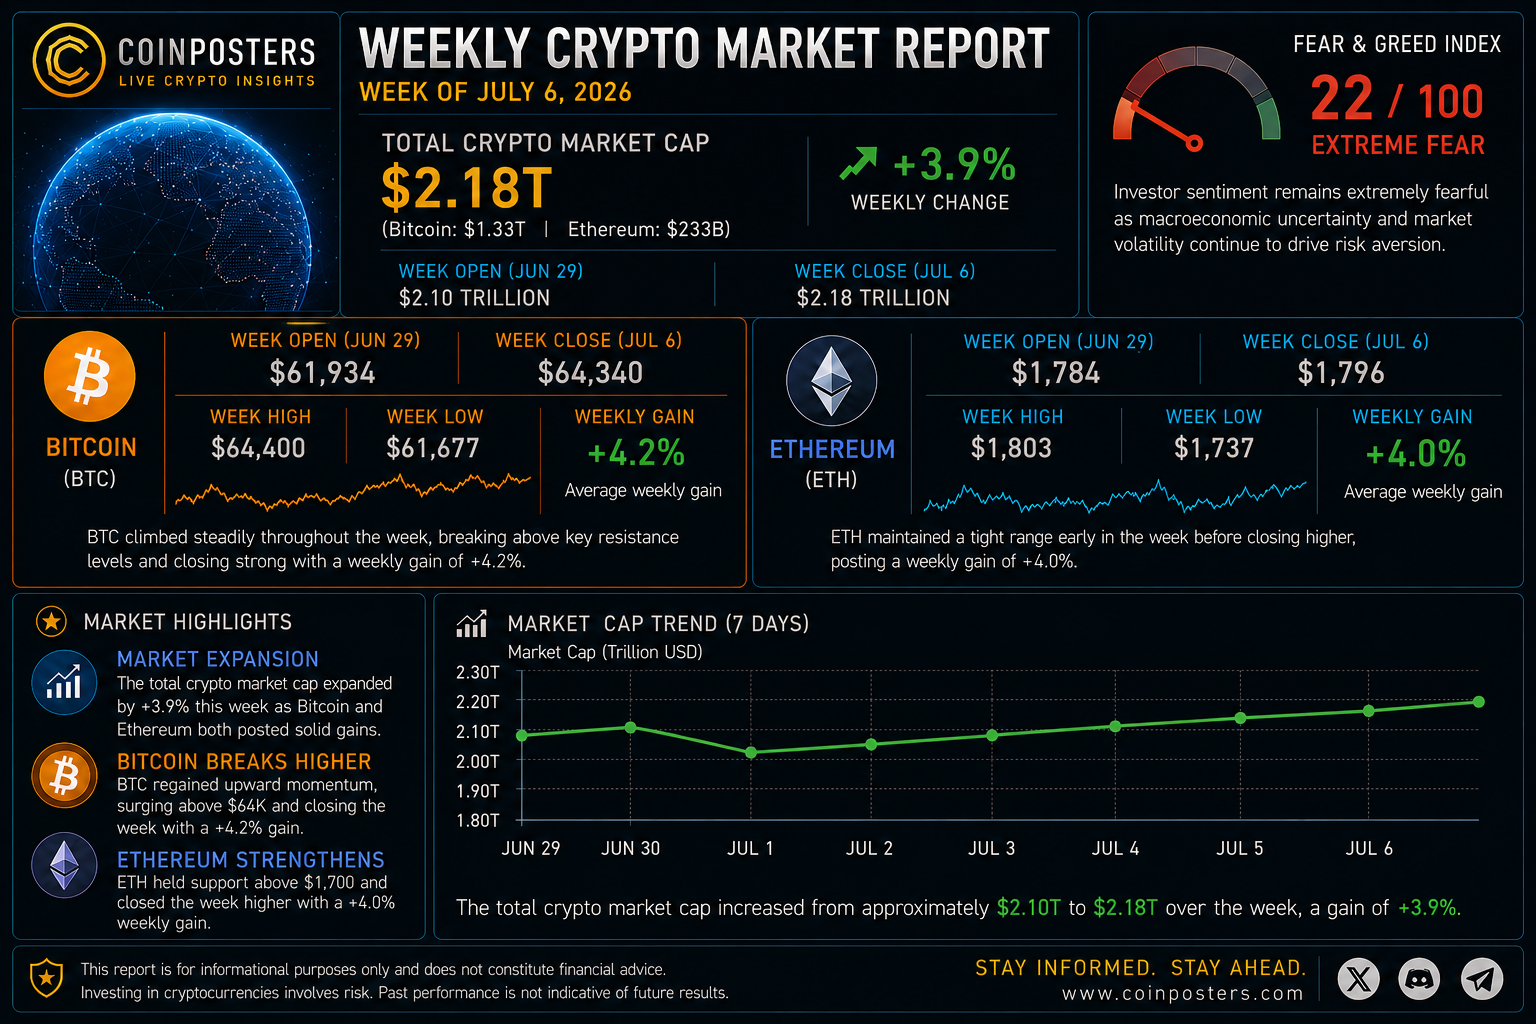
Bitcoin bounced roughly 6.8% off a 20-month low near $57,000 this week after softer jobs data eased rate pressure, but confirmation signals like a clean break above $64,000 and sustained spot volume are still missing, making this a promising relief rally rather than a confirmed trend reversal.
Article at a Glance: This Week’s Crypto Market Report
Here’s what this crypto market report for July 6, 2026 covers:
- Bitcoin rebounded from a cycle low near $57,000 to around $62,900, roughly a 6.8% weekly gain, after softer U.S. payroll data reduced near-term rate hike pressure and triggered a broad market recovery.
- Total crypto market cap climbed to approximately $2.26 trillion, up 6-8% from the prior week, with altcoins leading the charge and Bitcoin dominance dropping sharply from 58.2% to 55.7%.
- The $61.5K level on the 4-hour chart is the single most important number to watch, holding it keeps the recovery alive, but losing $60.5K reopens the path to the $57.4K liquidation pool below.
- Long-term holder wallets accumulated over 270,000 BTC in two weeks during the sub-$60K dip, signaling that large players treated the drawdown as an opportunity, not a breakdown.
- This recovery looks more like a positioning bounce than a confirmed trend reversal, the mid-July CPI print is the next macro catalyst that could determine whether this rally has real legs.
Table of Contents
- Bitcoin Rebounded From $57K, But Don’t Get Too Excited Yet
- Total Crypto Market Cap Jumped 6-8% in One Week
- Altcoins Led the Charge, Bitcoin Dominance Dropped to 55.7%
- The Technical Picture: Momentum, Volume, and What the Charts Say
- Long-Term Holders Are Quietly Accumulating While Others Panic
- The $57.4K Liquidation Pool Is the Risk Nobody Is Talking About
- What to Watch This Week to Stay Ahead of the Market
- How to Position Your Portfolio Given This Week’s Data
- Frequently Asked Questions
Crypto markets just delivered one of the sharpest one-week recoveries of the year, but whether it holds is a completely different question. This crypto market report for July 6, 2026 breaks down exactly what happened.
The week starting July 6 saw Bitcoin claw back above the psychologically critical $60,000 level after a brutal prior week that sent it to a 20-month low near $58,900. The catalyst was straightforward: a softer-than-expected U.S. jobs report shifted market expectations around Federal Reserve policy, easing real rate pressure and sending risk assets higher across the board. For context on how crypto markets track these macro shifts, resources covering weekly crypto market updates have become essential reading for serious market participants navigating these volatile conditions.
The recovery was fast, broad, and altcoin-led, which is both encouraging and worth treating with caution. Here is exactly what happened, what the data is telling us, and what to watch going into the second week of July.
Bitcoin Rebounded From $57K, But Don’t Get Too Excited Yet
Bitcoin staged a meaningful recovery last week, climbing from a cycle low near $57,000 to approximately $62,900 by the close of the weekly candle. That is a gain of roughly 6.8% on the week and a full reclaim of the $60,000 level, a zone that carries enormous psychological weight for the market. For more insights on the crypto market, check out this Crypto Market Report.
The prior week told a different story. A hot PCE inflation print had sent Bitcoin tumbling to $58,900, its lowest point in 20 months, triggering widespread fear and a test of the 200-week moving average. That test held. And that matters a great deal for the medium-term thesis.
The 200-week moving average has historically acted as the floor of every major Bitcoin bear cycle. The fact that price touched it and bounced, rather than breaking through, is being treated by long-term holders as confirmation that the macro bottom is either in or very close. But confirmation takes time, and one week of recovery does not erase the broader uncertainty.
Why Weaker U.S. Payroll Data Triggered the BTC Bounce
Bitcoin is highly sensitive to dollar liquidity and real rate expectations over short time horizons. When the U.S. jobs report came in softer than expected, the market immediately began pricing a less aggressive Fed path. That reduced the pressure on risk assets, including crypto, and gave traders a reason to step back in after the oversold conditions of the prior week.
Fed Chair Kevin Warsh’s tone in public comments also contributed to the shift in sentiment, adding to the narrative that the rate environment may be less hostile than feared. The combined effect was a sharp relief rally that lifted not just Bitcoin but the entire crypto complex in a broad, simultaneous move.
The $61.5K Level Every Bitcoin Holder Needs to Watch Right Now
The key short-term level right now is the 4-hour 50 EMA sitting around $61,500. As long as Bitcoin trades above this zone, any early-week pullback or sideways consolidation should be treated as healthy. It would signal that the market is simply digesting gains before the next leg rather than rolling over. For those considering the value of Bitcoin mining in 2026, staying informed on these levels is crucial.
A controlled retest of $61.5K that holds is actually the preferred scenario, it would give late buyers an entry and reset long leverage that built up during last week’s squeeze. The recovery target on the upside, if this level holds, is $69,000.
“Knowing these levels in advance removes emotion from the equation and lets you react to what the market actually does rather than what you hope it will do.”
What a Break Below $60.5K Would Mean for Your Portfolio
A confirmed break below $60,500 changes the picture materially. That level acts as secondary support, and losing it would signal that the bounce was purely technical rather than the beginning of a sustained recovery. In that scenario, the large liquidation pool sitting near $57,400 becomes the immediate downside magnet, and a retest of the cycle lows becomes the base case rather than the tail risk.
This is not a prediction. It is a framework. Knowing these levels in advance removes emotion from the equation and lets you react to what the market actually does rather than what you hope it will do.
Total Crypto Market Cap Jumped 6-8% in One Week
The total crypto market capitalization rose to approximately $2.26 trillion last week, representing a gain of roughly 6% to 8% from the prior week’s depressed levels. This was a broad market recovery, not a Bitcoin-only event, which is an important distinction when evaluating the quality of the move.
The fact that the total market cap recovered this much in a single week reflects both the depth of the prior oversell and the speed at which sentiment can shift when a macro catalyst aligns with technically oversold conditions. However, it also means that much of the easy upside from the washout low may already be priced in.
How the Market Got From Oversold to $2.26 Trillion
The sequence was mechanical. Extreme fear pushed Bitcoin to its 200-week moving average. Large holders, specifically wallets that accumulated more than 270,000 BTC over the two weeks prior, had been absorbing supply in the sub-$60,000 zone. When the macro catalyst arrived in the form of soft payrolls, short liquidations accelerated the move upward, adding momentum to what was already a technically primed setup.
The return above $60,000 also coincided with falling 30-day implied volatility in both BTC and ETH. The market stopped paying a premium for immediate downside protection, which reduced selling pressure and allowed prices to drift higher with less friction.
Why This Recovery Is Not Yet Confirmed as a Real Trend Reversal
Soft payrolls buy time. They do not confirm a durable turn. The recovery has cleared the largest short liquidation zone, which was the primary fuel for the squeeze, and that fuel is now largely spent. Without a new catalyst, the market faces a higher bar to continue pushing upward from current levels.
Bitcoin needs to clear and hold the $64,000 to $65,000 range to confirm the bottom is genuinely in. Until that happens, this recovery remains a high-probability relief bounce in a still-unresolved macro environment rather than the beginning of a confirmed new uptrend. For insights on the broader crypto market trends, check out the Crypto Market Report.
Altcoins Led the Charge, Bitcoin Dominance Dropped to 55.7%
One of the clearest signals from last week’s price action was what happened to Bitcoin dominance. It dropped from 58.2% to 55.7% in a single week, a large and fast move that tells you the recovery was disproportionately driven by altcoins rather than Bitcoin itself.
SOL gained 14.59% on the week, outperforming all major assets. ETH rose 13.59%. BTC gained 6.84%. The gap between those numbers tells the whole story: capital rotated aggressively into the broader altcoin complex the moment fear began to recede.
| Asset | Price | Weekly Gain |
|---|---|---|
| Solana (SOL) | ~$82 | +14.59% |
| Ethereum (ETH) | ~$1,790 | +13.59% |
| XRP | ~$1.17 | N/A |
| Bitcoin (BTC) | ~$62,900 | +6.84% |
Bitcoin Dominance Fell From 58.2% to 55.7%: What That Signals
A sharp one-week drop in Bitcoin dominance of this magnitude typically signals one of two things: either the beginning of a genuine altcoin season, or a high-volatility positioning bounce driven by short liquidations and fear reversal rather than real capital inflows. Given the context, spot volumes still below statistical norms, ETF flows only beginning to turn positive late in the week, this looks much more like the latter.
Ethereum Dominance Held Flat at 9.4%
Ethereum dominance remained essentially unchanged at 9.4%, even as ETH posted a 13.59% weekly gain. This apparent contradiction makes sense when you look at the math: if ETH rose but its share of total market cap stayed flat, the rest of the altcoin complex must have risen proportionally or faster, which is exactly what the dominance data confirms.
ETH recovered to around $1,790 on the week. It remains well below the levels many participants consider fair value relative to its fundamentals, which keeps the medium-term setup constructive but dependent on a broader market continuation.
Which Altcoin Sectors Drove the Bounce
The rotation went primarily into the broader altcoin complex rather than into Ethereum specifically. Solana at $82 and XRP at approximately $1.17 both reflected this dynamic, assets with higher beta to crypto sentiment moved the most when fear reversed. This is consistent with a liquidity and positioning bounce rather than sector-specific fundamental buying. Until spot volumes recover and ETF flows show sustained positive momentum, treating this altcoin outperformance as the start of a structural rotation would be premature.
The Technical Picture: Momentum, Volume, and What the Charts Say
The technical setup heading into the second week of July is cautiously constructive, but with enough warning signs to keep aggressive bulls honest. Bitcoin’s recovery from the $57,000 cycle low has improved the short-term structure meaningfully, but several indicators are flashing yellow rather than green, and the sustainability of the move still needs to be proven at higher price levels. For those wondering if Bitcoin mining is still worth it in 2026, these technical trends offer some context.
RSI Climbing Toward Overbought, How Close Are We?
The Relative Strength Index on the daily Bitcoin chart has rebounded sharply from deeply oversold territory. During the cycle low near $57,000, RSI pushed into levels not seen since the 2022 bear market lows, a zone that has historically preceded significant bounces. The subsequent recovery has now lifted RSI back into the mid-range, which creates room for continuation without immediate overbought risk.
That said, the speed of the recovery is worth monitoring. A rapid RSI expansion that moves too quickly toward the 70 threshold, especially on below-average spot volume, would signal that momentum is outpacing actual buying conviction. In that scenario, a cooling period becomes increasingly likely before any meaningful attempt at the $64,000 to $65,000 confirmation zone.
Spot CVD Is Still Negative But Stabilizing
Cumulative Volume Delta, which measures the net difference between aggressive buying and aggressive selling, remains negative on a macro basis despite last week’s price recovery. This tells you that the bounce was driven more by short liquidations and reduced selling pressure than by a genuine surge of new spot buying. The good news is that CVD has stopped deteriorating and is showing early signs of stabilization, which is a necessary precondition for a more sustainable recovery. It is not yet a buy signal, but it is no longer an active sell signal either.
Spot Volumes Remain Below Statistical Norms, A Red Flag for Bulls
Spot trading volumes across major venues remain below their statistical norms for a move of this magnitude. When price recovers 6% to 8% in a week but volume fails to confirm, it raises a straightforward question: who is actually buying? Low-volume recoveries are more vulnerable to reversal because they lack the broad participation needed to sustain higher prices against any meaningful selling pressure. Until spot volumes recover to at least average levels, every rally should be treated as fragile by default.
Long-Term Holders Are Quietly Accumulating While Others Panic
While short-term traders were rotating out during the drawdown to $57,000, a very different group was moving in the opposite direction. On-chain data shows that long-term holder wallets accumulated more than 270,000 BTC over the two weeks surrounding the cycle low, one of the most significant accumulation events of the current cycle.
This pattern is not new. It repeats at every major Bitcoin cycle bottom. The entities with the longest time horizons and the deepest conviction consistently add exposure when fear peaks and prices touch historically significant technical levels like the 200-week moving average. The sub-$60,000 zone was treated as a gift by this cohort, not a warning sign.
What On-Chain Data Reveals About Supply Absorption
The 270,000 BTC accumulated during the washout represents a meaningful reduction in available liquid supply. When large holders move coins into cold storage or long-term wallets, that supply is effectively removed from the market in the short to medium term. Combined with the 200-week moving average holding as support, the on-chain picture suggests that the structural floor for this cycle is being actively defended by the participants most likely to be right over a multi-month horizon.
ETF Flows Are Turning a Corner, But Not Yet Fully Confirmed
Bitcoin ETF flows were negative for most of the reporting period, extending a rough June, but showed early signs of turning positive toward the tail end of the week as the rally gained traction. This is a meaningful shift to watch closely rather than dismiss. It tells you that institutional and retail participants accessing Bitcoin through regulated ETF vehicles may be starting to re-engage, though a single positive session does not yet confirm a durable trend. For the recovery to graduate from a technical bounce to a confirmed trend reversal, ETF flows need to stay positive for multiple consecutive sessions, because that is where the largest pools of new capital sit.
Why the Bottoming Process Is Advancing But Not Yet Complete
The combination of long-term holder accumulation, 200-week moving average support, improving Fear and Greed Index readings, early signs of ETF flows turning positive, and a macro catalyst that reduces rate pressure all point in the same direction: the bottoming process is advancing. But advancing is not the same as complete. The missing pieces are sustained positive ETF inflows over multiple sessions, above-average spot volume confirming the recovery, and a clean break above the $64,000 to $65,000 resistance zone. Until those three conditions are met, the most accurate description of current market conditions is early-stage bottoming, not confirmed reversal.
The $57.4K Liquidation Pool Is the Risk Nobody Is Talking About
Everyone is focused on the upside targets. The $64,000 resistance zone, the $69,000 recovery target, the potential for a new all-time high if macro conditions cooperate. But the single most important risk management level in the current setup is not above current price, it is below it. The large liquidation pool sitting near $57,400 is the gravitational downside magnet that becomes the primary target if Bitcoin fails to hold its key support levels.
- $61,500: The 4-hour 50 EMA, the first line of defense for the current recovery
- $60,500: Secondary support, losing this level weakens the structure materially
- $57,400: The large liquidation pool, the destination if both levels above fail
- $57,000: The cycle low, the ultimate line in the sand for the medium-term bull case
Liquidation pools form when a large concentration of leveraged long positions cluster around a specific price level. Market makers and algorithmic traders are acutely aware of where these pools sit, and price has a measurable tendency to gravitate toward them during periods of low liquidity or sentiment deterioration, not because of manipulation, but because of the mechanical reality of how leveraged markets function.
The scenario to avoid is a slow, grinding erosion of the $61,500 level that turns into a cascade through $60,500 and eventually sweeps the $57,400 pool. That would not necessarily be the end of the bull case, the 200-week moving average held the prior test, but it would reset the recovery timeline significantly and cause substantial damage to leveraged long positions built during last week’s squeeze.
What to Watch This Week to Stay Ahead of the Market
Three things will determine whether this recovery extends or stalls in the week ahead. First: whether Bitcoin can convert the $60,000 reclaim into a sustained hold above $64,000. Second: whether spot volumes begin recovering toward statistical norms, validating the price action. Third: the mid-July CPI print, which is the next scheduled macro catalyst with the power to meaningfully shift rate expectations.
Each of these has a clear binary outcome. Bitcoin either holds and builds above $64,000 or it doesn’t. Volume either confirms or it doesn’t. CPI either comes in soft, extending the relief rally, or it comes in hot, which would immediately reprice rate expectations and put renewed downward pressure on risk assets including crypto.
Key Price Levels That Will Decide the Next Directional Move
On the upside, the critical zone to watch is $64,000 to $65,000. A clean break and weekly close above this range would be the first technical signal that the bottom is confirmed rather than merely probable. On the downside, $61,500 and $60,500 are the sequential levels to defend. Lose both, and the probability of a $57,400 retest rises substantially. These are not opinions, they are the structural levels the market itself has defined through price action and order flow.
Macro Events and Data Releases That Could Move Crypto
The macro calendar is the most important external input for crypto markets right now. Bitcoin proved last week that it remains acutely sensitive to U.S. economic data, the soft payrolls report was the primary trigger for the recovery from cycle lows. That sensitivity cuts both ways: positive macro surprises can accelerate the recovery, while negative ones can unwind it just as quickly.
The mid-July CPI print is the single most important scheduled event on the calendar. If inflation continues to moderate, it reinforces the case for a less aggressive Fed and extends the runway for risk asset recovery. If it surprises to the upside, as the prior PCE print did when it drove Bitcoin to $58,900, it could trigger a second leg down before the bottoming process completes.
Beyond CPI, watch for any Fed commentary or speeches that signal a shift in the rate outlook. Fed Chair Warsh’s tone last week was a contributor to the recovery, and any reversal of that dovish lean could immediately pressure crypto markets. The interplay between macro policy signals and crypto price action has never been tighter than it is in the current cycle.
Key Events to Monitor, Week of July 7, 2026
| Event | Expected Impact | Bullish Scenario | Bearish Scenario |
|---|---|---|---|
| Mid-July CPI Print | High | Soft print extends relief rally toward $65K | Hot print reopens path to $57.4K |
| Fed Chair Commentary | Medium-High | Dovish tone sustains rate relief narrative | Hawkish shift reprices rate expectations |
| Bitcoin ETF Flow Data | Medium | Sustained inflows confirm institutional re-entry | Reversal back to outflows signals weak conviction |
| BTC 4H 50 EMA Hold at $61.5K | High | Hold confirms controlled consolidation | Break below $60.5K weakens structure |
| Spot Volume Recovery | Medium | Volume expansion validates price recovery | Continued low volume signals fragile bounce |
How to Position Your Portfolio Given This Week’s Data
The data from this week gives you a clear framework, not a guarantee, but a structured way to think about risk and exposure that removes emotion from the equation. The recovery is real, the macro catalyst was legitimate, and the on-chain accumulation by long-term holders is genuinely constructive. But the confirmation signals that would justify aggressive positioning are still missing.
Position sizing right now should reflect that reality. This is not a moment for maximum conviction in either direction. It is a moment for calibrated exposure, enough to participate if the recovery extends, small enough to survive intact if the $57.4K liquidation pool gets swept before the next leg higher begins.
The three positioning principles below are directly derived from the price levels, on-chain data, and macro context discussed throughout this report. Apply them in order of priority.
1. Hold Bitcoin Only If the $61.5K Level Holds on the 4-Hour Chart
This is the single most actionable rule from this week’s data. The 4-hour 50 EMA at $61,500 is the technical line that separates controlled consolidation from a setup that is beginning to deteriorate. As long as Bitcoin trades above it, existing long positions are justified. The moment it breaks with conviction, not a brief wick, but a candle close below, the risk profile of holding changes materially.
If you are holding Bitcoin here, define your exit before you need it. A close below $60,500 on the 4-hour chart is the secondary confirmation that the structure has weakened. Waiting for that level to break before reducing exposure is a reasonable stop-loss framework that gives the trade room to breathe while still protecting against a cascade toward the cycle lows.
| Scenario | BTC Price Action | Suggested Positioning | Next Key Level |
|---|---|---|---|
| Bullish Continuation | Holds above $61.5K, pushes toward $65K | Maintain or add to BTC exposure on confirmed hold | $64,000-$65,000 resistance zone |
| Controlled Consolidation | Ranges between $61.5K and $63K | Hold existing positions, avoid adding leverage | $61,500 4H 50 EMA |
| Structure Weakening | Breaks below $60.5K on 4H close | Reduce exposure, move to partial cash | $57,400 liquidation pool |
| Full Retest | Sweeps $57.4K liquidation pool | Dry powder deployment zone, scale in carefully | $57,000 cycle low |
The goal here is not to predict which scenario plays out, it is to have a pre-defined response to each one. Markets reward preparation, not reaction.
One practical note: use the 4-hour chart specifically, not the 1-hour or 15-minute. Shorter timeframes generate too much noise around this level and will trigger false signals. The 4-hour 50 EMA is the institutional reference point for this setup, and it is the timeframe where the level carries the most structural weight. For those looking to explore more about cryptocurrency investment strategies, consider reading how beginners can invest in cryptocurrency with low risk.
2. Treat Altcoin Exposure as High Risk Until Volume Confirms the Rally
Altcoins outperformed Bitcoin significantly last week, SOL up 14.59%, ETH up 13.59% versus BTC’s 6.84%, but the driver was short liquidations and fear reversal rather than genuine capital inflows. Until spot volumes recover to at least average levels and ETF flows show sustained positive momentum, altcoin exposure carries materially higher risk than the weekly price gains suggest. The same dynamics that created the sharp upside bounce can create an equally sharp reversal.
If you hold altcoin positions from lower levels, this is a reasonable zone to take partial profits or tighten stops rather than add new exposure. If you are considering entering new altcoin positions, wait for volume confirmation first. A rally that cannot attract volume is a rally that cannot sustain itself, and in a low-volume environment, altcoins with high beta to sentiment will suffer the most if the macro picture deteriorates before the mid-July CPI print.
3. Keep Dry Powder Ready for a Potential Retest Near $57K
The most disciplined positioning strategy in a low-confirmation recovery is to maintain meaningful cash reserves specifically earmarked for deployment near the cycle low. The $57,400 to $57,000 zone has now been established as a historically significant level, the 200-week moving average held there, and long-term holders accumulated aggressively in that range. If price returns to that zone, the risk-reward for adding exposure becomes extremely favorable for investors with a multi-month time horizon.
This is not a prediction that Bitcoin will revisit $57K. It is an acknowledgment that it could, and that being prepared for that scenario is more valuable than being fully invested before confirmation arrives. Dry powder is not a missed opportunity. In an unconfirmed recovery, it is your most important asset. For those exploring different investment options, understanding the dynamics of Bitcoin vs. Ethereum could provide valuable insights.
The Market Bounced, But the Next Move Will Separate Patient Investors From Reactive Ones
Last week’s recovery from the $57,000 cycle low is meaningful, and the data behind it, 200-week moving average support, 270,000 BTC accumulated by long-term holders, a macro catalyst that reduced rate pressure, and a broad market cap recovery to $2.26 trillion, gives legitimate reason for cautious optimism. But the confirmation signals that define the difference between a durable recovery and a high-quality bear market bounce are still ahead of us. The $64,000 to $65,000 resistance zone, sustained positive ETF flows, above-average spot volume, and a soft mid-July CPI print are the four markers that will tell you whether this is the beginning of the next leg higher or a temporary reprieve before one more sweep of the lows. Watch the levels, manage the risk, and let the market confirm before you commit. For those considering diversifying their portfolio, exploring the fastest growing altcoins might be a worthwhile strategy.
Frequently Asked Questions
The week of July 6, 2026 generated a significant number of questions from market participants trying to understand both the magnitude of the recovery and what it actually means for their portfolios going forward.
Below are the most important questions answered directly, using the data from this week’s market report as the foundation for each response.
Why Did Bitcoin Drop to $57,000 Before the July 6 Rebound?
Bitcoin dropped to approximately $57,000, its lowest level in 20 months, primarily because of a hot PCE inflation print that preceded the week of July 6. That data point drove market expectations toward a more aggressive Federal Reserve rate path, which increased real rate pressure on risk assets and triggered a broad sell-off that pushed Bitcoin to test its 200-week moving average near $58,900. The drop was amplified by leveraged long liquidations, which created a cascade effect once key support levels gave way. The combination of a macro shock, technical breakdown below $60,000, and forced liquidations produced the oversold conditions that ultimately set up the sharp recovery when the softer payroll data arrived the following week.
What Does Bitcoin Dominance Falling to 55.7% Mean for Altcoin Investors?
Bitcoin dominance falling from 58.2% to 55.7% in a single week means that altcoins outperformed Bitcoin significantly during the recovery. For altcoin investors, it signals that the market rotated aggressively into higher-beta assets the moment fear began to recede. However, given that spot volumes remain below statistical norms and ETF flows are only just beginning to turn positive, this dominance drop looks more like a short-squeeze-driven positioning bounce than the beginning of a structural altcoin season. Treat it as a positive data point, but not yet as confirmation of a sustained rotation.
Is the Current Crypto Recovery a Real Bull Signal or a Dead Cat Bounce?
The honest answer is: it is too early to say definitively. The recovery has genuine structural support behind it, the 200-week moving average held, long-term holders accumulated 270,000 BTC during the drawdown, and the macro catalyst that triggered the bounce was legitimate rather than manufactured. Those are not characteristics of a typical dead cat bounce.
However, the missing confirmation signals, sustained positive ETF flows over multiple sessions, above-average spot volume, and a clean break above $64,000 to $65,000, are the same signals that would definitively separate a real bull continuation from a high-quality relief rally. Until those boxes are checked, the most accurate label for the current environment is early-stage bottoming, which sits somewhere between a dead cat bounce and a confirmed bull signal on the spectrum of market recoveries.
What Is the Significance of the $57.4K Liquidation Pool for Bitcoin?
A liquidation pool forms when a large concentration of leveraged long positions cluster around a specific price level. The pool near $57,400 represents a zone where a significant number of long positions have their liquidation prices set, meaning that if Bitcoin trades down to that level, those positions get automatically closed, which adds selling pressure and can accelerate the move lower in a self-reinforcing cascade.
Market participants, from algorithmic traders to institutional desks, are fully aware of where these pools sit. Price has a measurable tendency to gravitate toward them during periods of low liquidity or sentiment deterioration, not as a result of deliberate manipulation, but because of the mechanical structure of how leveraged derivatives markets function. The $57,400 pool is the gravitational magnet on the downside if Bitcoin loses both the $61,500 and $60,500 support levels.
The good news is that the 200-week moving average sits in the same general zone as this liquidation pool, near $57,000. That means the same level that would attract a liquidation cascade also represents one of the most historically significant long-term support levels in Bitcoin’s entire price history. If price does reach $57,400, it arrives at a zone where both mechanical selling pressure and long-term holder conviction are likely to converge simultaneously.
How Should I Adjust My Crypto Portfolio During a Low-Volume Recovery?
A low-volume recovery is a specific market condition that requires a specific response: reduce position sizing relative to what you would carry in a high-conviction, volume-confirmed uptrend. The absence of volume means the recovery is more fragile than the price action alone suggests, and position sizes should reflect that fragility rather than the optimism the price gains naturally create.
For Bitcoin specifically, the $61,500 level on the 4-hour chart is your primary reference point. Hold existing positions above it, but avoid adding meaningfully to exposure until either volume confirms or the $64,000 to $65,000 resistance zone is cleanly broken. For altcoins, the same volume-confirmation rule applies with even more urgency, altcoins with high beta to sentiment will reverse faster and harder than Bitcoin if the recovery stalls.
Cash is a position. In a low-volume, unconfirmed recovery, maintaining 20% to 40% of your intended crypto allocation in stablecoins or cash gives you the flexibility to either add on confirmation or deploy aggressively if the $57,400 zone is swept before the next leg higher. The worst outcome is being fully invested at current levels with no dry powder if the market offers a significantly better entry in the weeks ahead.
Finally, the mid-July CPI print is the scheduled event most likely to resolve the current uncertainty. If you are uncomfortable with the ambiguity of the current setup, reducing exposure ahead of that data point, and re-entering based on the market’s reaction, is a completely rational strategy. Managing risk around known macro catalysts is not weakness. It is how disciplined participants protect capital while staying positioned for the opportunities that follow.
DYOR Disclaimer
This article is for informational purposes only and does not constitute financial, investment, or tax advice. Cryptocurrency markets are highly volatile and past performance does not indicate future results. Always do your own research (DYOR) and consult a qualified financial professional before making any investment decisions.





Latest
Market Brief
08 Jul 2026
Market Brief
04 Jul 2026
Market Brief
21 May 2026
Market Brief
13 May 2026
Market Brief
28 Apr 2026
Market Brief
15 Mar 2026