James Carter
The Ethereum Rainbow Chart: Unveiling Market Trends and Opportunities
Ethereum, the second-largest cryptocurrency by market capitalization, has gained significant attention and adoption in recent years. Known for its smart contract capabilities and decentralized applications, Ethereum has become a prominent player in the blockchain industry.
1. Purpose and Significance of the Ethereum Rainbow Chart
The Ethereum Rainbow Chart is a powerful tool that aids traders and investors in analyzing market trends, identifying key support and resistance levels, and determining potential buying and selling opportunities. By visualizing historical price data in a unique format, the Rainbow Chart provides insights into the market cycles and helps navigate the volatile cryptocurrency landscape.
1.1 Brief Explanation of the Rainbow Chart Concept
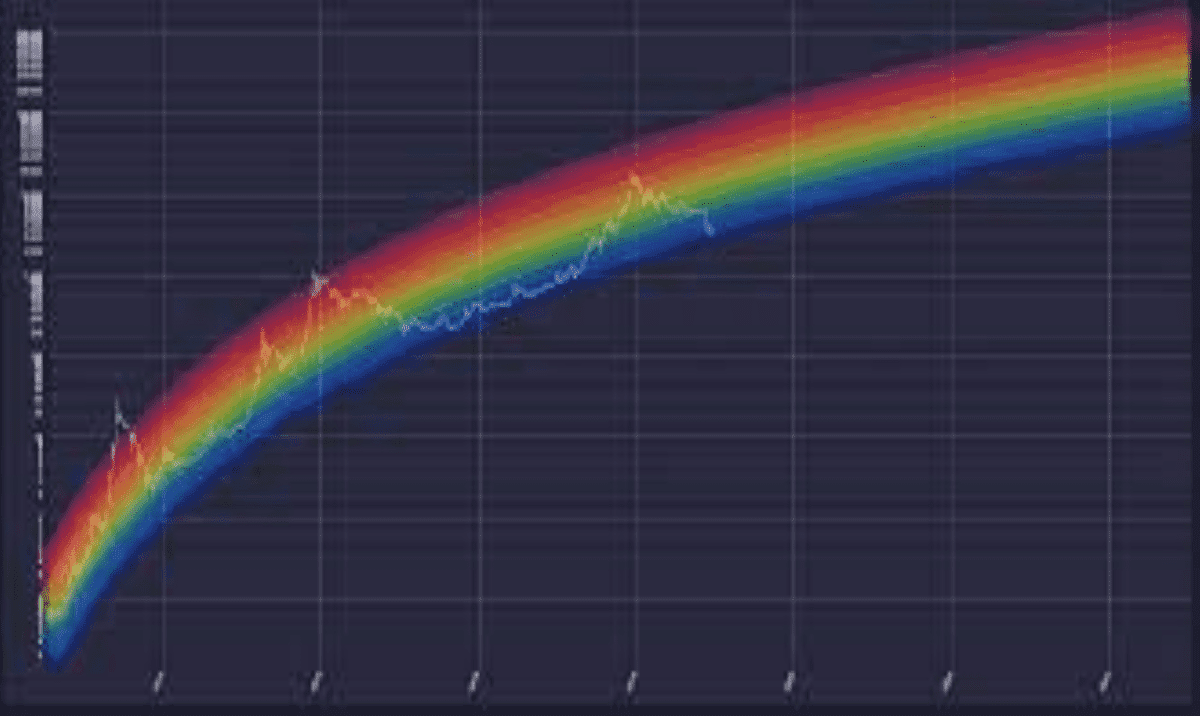
The Rainbow Chart is based on the concept of color bands representing different price zones. These bands reflect the logarithmic price scale and are divided into specific regions based on historical price patterns. The chart offers a visual representation of Ethereum’s price movements over time, enabling traders to make informed decisions.
2. Understanding the Ethereum Rainbow Chart
2.1 Definition and Key Features
The Ethereum Rainbow Chart is a logarithmic price chart that uses color bands to represent different price zones. Each color band signifies a specific range of prices and helps identify key support and resistance levels. The logarithmic scale ensures that price changes are proportionally represented, accounting for both large and small price movements.
2.2 Historical Price Analysis
The Rainbow Chart utilizes historical price data to analyze Ethereum’s market cycles and trends. By examining the past performance of Ethereum, patterns and trends can be identified, allowing traders to anticipate potential future price movements.
2.3 Interpretation of Color Bands and Price Zones
The Rainbow Chart is divided into distinct color bands, each representing a different price zone. These color bands can be interpreted as areas of support or resistance, indicating potential buying or selling opportunities. Traders can analyze the chart to identify the optimal entry and exit points based on the prevailing price zone.
2.4 Relationship between Price and Time
The Rainbow Chart’s design highlights the relationship between price and time. Traders can observe the movement of Ethereum’s price across different color bands and assess how long it has spent in each zone. This information can provide insights into the strength and duration of trends, aiding in decision-making.
3. Methodology
3.1 Data Collection and Analysis
To construct the Ethereum Rainbow Chart, historical price data is collected from reliable sources and analyzed. The data is typically obtained from cryptocurrency exchanges and includes factors such as open, high, low, and close prices. Rigorous analysis techniques are applied to ensure the accuracy and validity of the data.
3.2 Calculation of Price Zones and Color Bands
The Rainbow Chart’s price zones and color bands are determined through careful consideration of historical price patterns. Factors such as significant price levels, support and resistance zones, and trend analysis are taken into account to create the distinct regions on the chart.
3.3 Factors Considered in Determining the Chart’s Parameters
When developing the Ethereum Rainbow Chart, various factors are considered to define its parameters. These factors may include historical price volatility, market trends, and the specific characteristics of Ethereum as a cryptocurrency. The parameters are adjusted periodically to reflect the changing dynamics of the market.
3.4 Transparency and Reliability of the Methodology
Transparency and reliability are crucial aspects of the Ethereum Rainbow Chart methodology. Traders and investors must have confidence in the accuracy and validity of the chart’s construction. The methodology should be well-documented and subject to review and scrutiny by the community to ensure transparency and accountability.
4. Interpretation and Application
4.1 Identifying Market Cycles and Trends
One of the primary benefits of the Ethereum Rainbow Chart is its ability to identify market cycles and trends. Traders can visually observe the movement of Ethereum’s price within the color bands and analyze the duration and intensity of each cycle. This information helps in understanding whether the market is in a bullish or bearish phase, enabling traders to align their trading strategies accordingly.
4.2 Support and Resistance Levels
The Rainbow Chart provides valuable insights into support and resistance levels. Support levels represent price zones where buying pressure is expected to be strong, potentially leading to a price reversal or bounce. Resistance levels, on the other hand, indicate areas where selling pressure may increase, causing the price to struggle in breaking through. By identifying these levels on the Rainbow Chart, traders can make informed decisions about setting stop-loss orders, taking profits, or entering new positions.
4.3 Assessing Potential Buying and Selling Opportunities
The Ethereum Rainbow Chart helps traders assess potential buying and selling opportunities based on the prevailing price zone. When Ethereum’s price is within the lower color bands, it may indicate an oversold condition, presenting a buying opportunity. Conversely, when the price reaches the upper color bands, it may suggest an overbought condition, signaling a potential selling opportunity. By considering the chart alongside other technical indicators and fundamental analysis, traders can make well-informed decisions.
4.4 Managing Risk and Setting Stop-Loss Orders
Risk management is a crucial aspect of trading, and the Rainbow Chart can assist in setting appropriate stop-loss orders. Traders can identify key support levels on the chart and place stop-loss orders slightly below these levels to protect against potential downside risks. This approach helps in minimizing losses and preserving capital in the event of adverse price movements.
5. Limitations and Considerations
5.1 Historical Data Limitations
The Ethereum Rainbow Chart relies on historical price data, which may have limitations. Price movements in the future might not necessarily follow the same patterns observed in the past. Therefore, it is essential for traders to consider current market conditions and adapt their strategies accordingly.
5.2 Market Volatility and Unpredictability
Cryptocurrency markets, including Ethereum, are known for their volatility and unpredictability. While the Rainbow Chart provides valuable insights, it should not be considered as the sole indicator for making trading decisions. Traders should use it in conjunction with other technical analysis tools, fundamental analysis, and market sentiment to form a comprehensive trading strategy.
5.3 Potential Risks of Relying Solely on the Rainbow Chart
Relying solely on the Rainbow Chart without considering other factors may increase the risk of making erroneous trading decisions. It is essential to understand that the chart provides a historical perspective and does not guarantee future price movements. Traders should conduct thorough analysis and consider multiple indicators before executing trades.
5.4 Complementary Analysis and Indicators
To enhance the effectiveness of the Rainbow Chart, traders can incorporate complementary analysis and indicators. This may include trend lines, moving averages, oscillators, and volume indicators. By combining multiple tools and indicators, traders can gain a more comprehensive understanding of the market dynamics and increase the accuracy of their predictions.
WATCH THE VIDEO BELOW FOR MORE CLARIFICATIONS.
6. Examples and Case Studies
6.1 Real-World Examples Showcasing the Rainbow Chart’s Usefulness
By examining historical price data, several real-world examples demonstrate the usefulness of the Ethereum Rainbow Chart. These examples could include instances where the Rainbow Chart accurately identified major trend reversals, support and resistance levels, or provided insights into prolonged bullish or bearish phases. Analyzing these cases provides practical illustrations of the chart’s effectiveness in capturing market trends and opportunities.
6.2 Comparative Analysis with Other Price Charts and Indicators
To showcase the unique advantages of the Rainbow Chart, a comparative analysis with other popular price charts and indicators can be conducted. This analysis could highlight the distinctive features and benefits offered by the Rainbow Chart, demonstrating its value as a tool for technical analysis in the cryptocurrency market.
Summary
The Ethereum Rainbow Chart is a powerful tool that provides traders and investors with valuable insights into market trends, support and resistance levels, and potential buying and selling opportunities. Its unique color band representation and logarithmic scale offer a visual perspective on Ethereum’s price movements over time.
However, it is crucial to recognize the limitations of the Rainbow Chart. Historical data may not accurately predict future price movements, and market volatility can impact the effectiveness of the chart. Relying solely on the Rainbow Chart without considering other indicators and analysis tools may increase the risk of making erroneous trading decisions.


Latest
Ethereum
08 Jul 2026
Ethereum
04 Jul 2026
Ethereum
21 May 2026
Ethereum
13 May 2026
Ethereum
15 Mar 2026