altcoin analysis
bitcoin dominance
bitcoin price
crypto market report June 15 2026
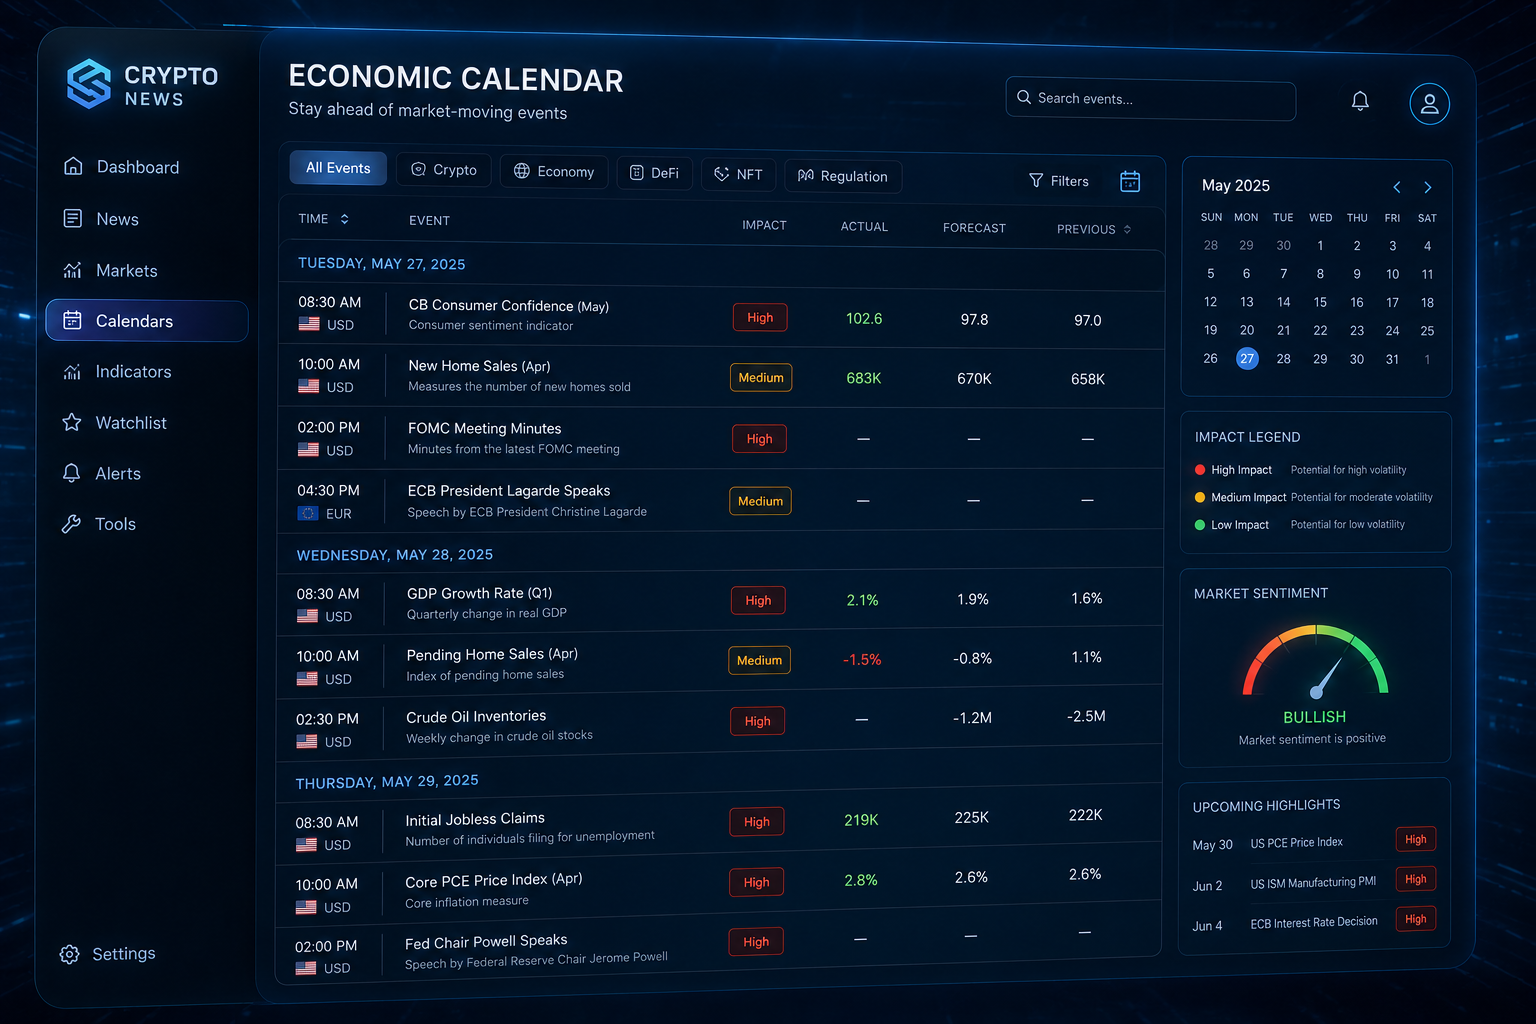
crypto news calendar
Crypto portfolio
crypto trading signals
DeFi protocols
ENA breakout
ETF flows
Ethereum news
institutional buying
Market analysis
market trends 2026
miner capitulation
perpetual CVD
RSI signals
Solana trading
Technical Analysis
weekly crypto market report
Coinposters
Crypto Market Report June 15 2026: Weekly Price Trends, Breakouts & Portfolio Insights
The crypto market report June 15 2026 reveals a critical inflection point: Bitcoin reclaimed $65,000, institutional flows reversed, and multiple bottom indicators fired simultaneously. This weekly crypto market report June 15 2026 breaks down the signals that matter most — from miner capitulation to the Ethena breakout setup — and shows why this recovery could mark the end of crypto winter.
Key Takeaways: Crypto Market Report June 15 2026
- •Bitcoin reclaimed the $65,000 level in mid-June 2026 after a turbulent start to the month, driven by easing geopolitical tensions and falling oil prices.
- •The total crypto market cap sits at approximately $2.16 trillion, with Bitcoin dominance holding strong above 58% — signaling that altcoin season has not yet fully arrived.
- •Ethena (ENA) is flashing a high-probability breakout setup this week, making it the chart to watch closely heading into the next trading sessions.
- •Perpetual CVD flipped from -$770M to +$182M — a key momentum shift that historically precedes sustained directional moves in Bitcoin.
- •Standard Chartered has officially called the end of the crypto winter, and on-chain mining data is backing that thesis up — but one key RSI signal says traders should stay cautious.
Article at a Glance: This crypto market report June 15 2026 is the most comprehensive weekly analysis available for investors seeking to understand the current market inflection. You’ll learn what drove Bitcoin back above $65,000, which altcoins are showing the strongest technical setups, what institutional money is actually doing right now, and the specific framework for deciding whether to buy, hold, or wait for more confirmation. The crypto market report June 15 2026 also covers the Ethena (ENA) breakout setup that traders should be monitoring closely.
Table of Contents
- Bitcoin Reclaims $65K — Here’s What Drove the Relief Rally
- Weekly Price Snapshot: Winners, Losers & Standouts
- Chart of the Week: Ethena (ENA) Breakout Setup
- Is This the Macro Cycle Bottom? What Analysts Are Saying
- Major Market Developments That Moved Prices This Week
- Portfolio Insights: What This Week’s Data Tells Investors
- Key Events to Watch in the Week Ahead
- Frequently Asked Questions
The crypto market just flipped the script after one of the most anxiety-filled weeks of 2026.
After a rough start to June marked by macro uncertainty, equity selloffs, and ETF outflows, digital assets staged a meaningful recovery. Bitcoin pushed back above $65,000, Ethereum crossed the $2,000 threshold again, and select altcoins posted double-digit gains. Coinposters provides ongoing market analysis and reporting that helps investors track these fast-moving developments — you can explore their latest insights at Coinposters News.
This isn’t just a bounce. Several converging signals — from miner capitulation metrics to shifting institutional flows — are pointing toward something more structural. Here’s everything that moved the market this week, broken down clearly so you can act on it.
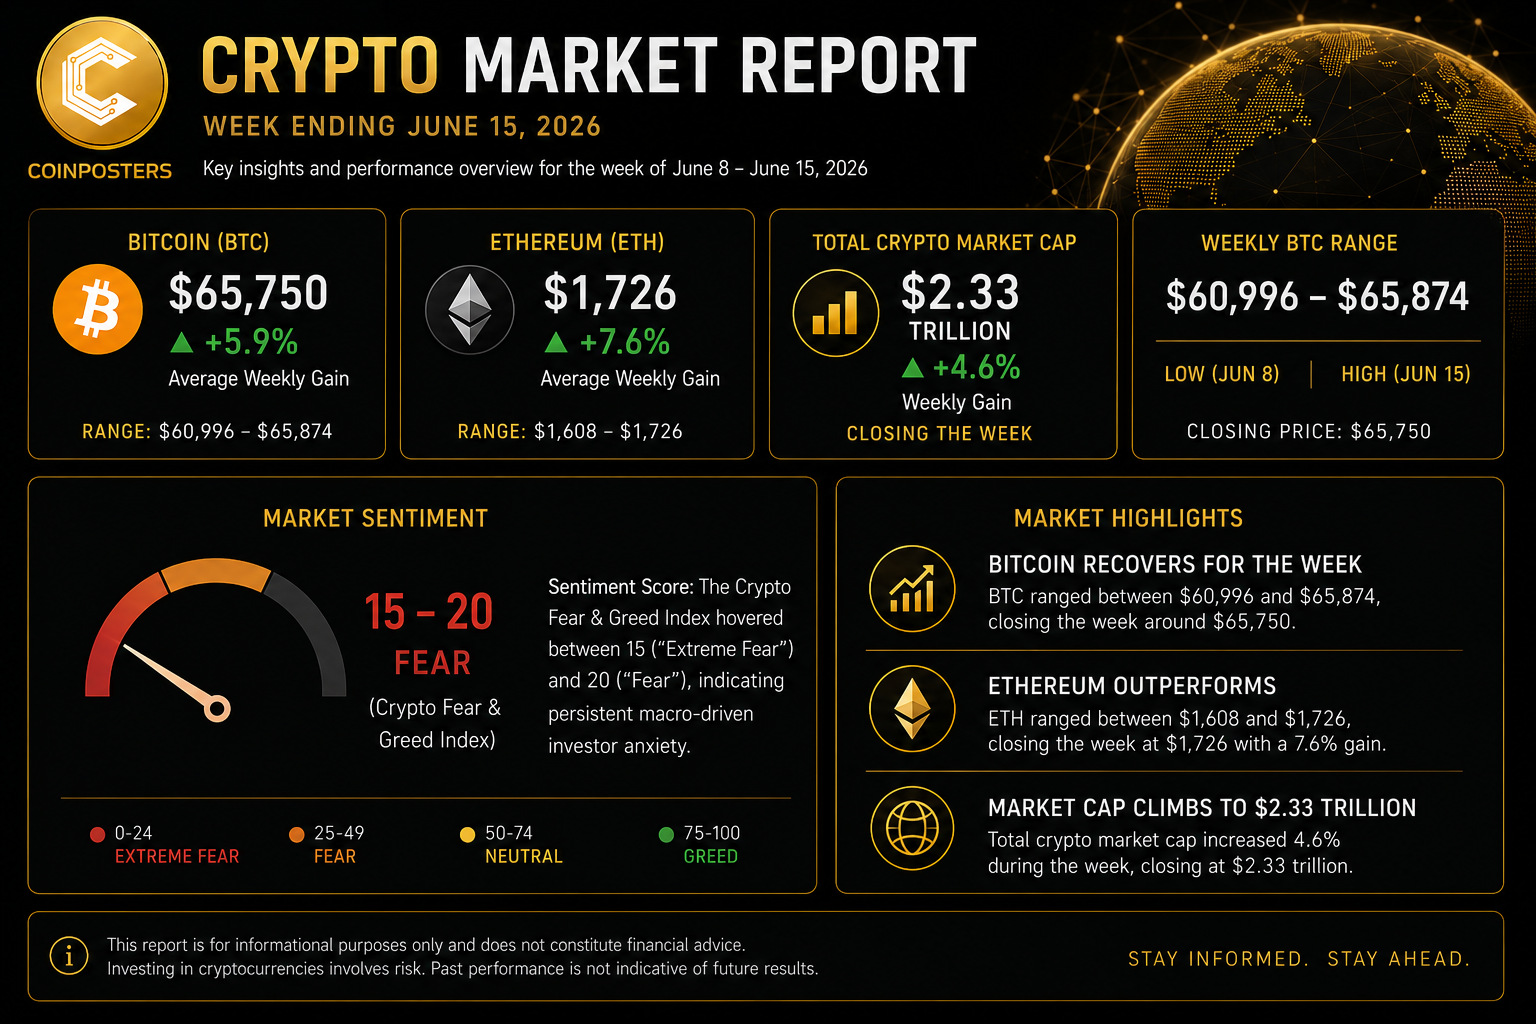
Crypto Market At-a-Glance: June 2026
| Metric | Value |
|---|---|
| Total Crypto Market Cap | ~$2.16 Trillion |
| Bitcoin Dominance | ~58% |
| BTC Price | ~$65,000 |
| ETH Price | ~$2,000+ |
| 24H Trading Volume | ~$48 Billion |
| Perpetual CVD Shift | -$770M → +$182M |
Bitcoin Reclaims $65K — Here’s What Drove the Relief Rally
Bitcoin spent most of early June under pressure. Macro headwinds — including elevated oil prices tied to Middle East tensions and stubborn rate expectations — kept risk appetite suppressed across both equities and crypto. BTC was trading below key support levels, sentiment was bearish, and outflows from spot Bitcoin ETFs were accelerating. For those looking to safely navigate DeFi protocols during such volatile times, understanding market dynamics is crucial.
Then the macro backdrop shifted. Reports of a potential US-Iran peace framework began circulating, oil prices retreated sharply, and the pressure valve released. Bitcoin responded almost immediately, pushing back above $65,000 and stabilizing in a range that traders had been watching closely.
US-Iran Peace Framework Eased Oil Shock Fears
Energy markets and crypto markets are more connected than most people realize. When oil prices spike, inflation expectations rise, rate cut timelines get pushed back, and risk assets — including Bitcoin — take the hit. The easing of US-Iran tensions this week removed one of the biggest macro overhangs that had been suppressing crypto prices since late May. Oil prices retreated, bond yields softened slightly, and crypto found room to breathe.
This wasn’t a fundamental crypto catalyst. It was a macro unlock — and that distinction matters for how long this rally can last without follow-through from on-chain or institutional demand.
BTC Dominance Holds Above 58% as Altcoin Rotation Stays Muted
Bitcoin dominance remaining above 58% tells an important story about where the market is in the cycle. Capital is still concentrated in BTC. Investors aren’t yet rotating aggressively into altcoins, which means this rally is being led by the safest crypto asset — a sign of caution, not euphoria. Historically, broad altcoin seasons begin when BTC dominance starts declining meaningfully from elevated levels. That hasn’t happened yet.
What this means practically: selective altcoin opportunities exist (more on ENA below), but blanket exposure to small-cap tokens remains premature until dominance starts compressing.
Perpetual CVD Flipped From -$770M to +$182M — What That Means
Cumulative Volume Delta (CVD) on perpetual futures measures the net difference between buy and sell volume over time. When CVD is deeply negative, sellers are in control. When it flips positive, buyers are stepping in with conviction. This week, Bitcoin’s perpetual CVD shifted from -$770 million to +$182 million — a nearly $1 billion swing in net buying pressure. That’s not noise. It reflects a structural change in how derivatives traders are positioning, and it’s one of the strongest short-term signals that the relief rally has real buying support behind it rather than just short liquidations driving prices higher.
Weekly Price Snapshot: Winners, Losers & Standouts
Most major assets finished the week in positive territory, but performance was far from uniform. Here’s how the top assets stacked up across the seven-day period ending mid-June 2026.
Weekly Asset Performance
| Asset | Weekly Change |
|---|---|
| Solana (SOL) | +13.28% |
| Ethereum (ETH) | +7.54% |
| XRP | +7.16% |
| Bitcoin (BTC) | +6.25% |
| BNB | Positive (modest) |
| Tron (TRX) | -1% |
Solana Leads With +13.28% Weekly Gain
Solana was the clear outperformer this week, gaining over 13% while Bitcoin managed 6.25%. SOL’s move came on the back of renewed developer activity, improving DEX volume on the Solana network, and broader risk appetite returning to higher-beta crypto assets. When sentiment improves in crypto, Solana tends to amplify those moves — and this week was no different.
That said, the move hasn’t yet confirmed a new macro uptrend for SOL. Traders watching for sustained strength will want to see volume hold and weekly closes above recent resistance before adding significant exposure.
Ethereum Up 7.54% But Market Share Stays Below 10%
Ethereum reclaimed the psychologically significant $2,000 level this week — a milestone that had eluded it for most of June. The 7.54% weekly gain is encouraging, but Ethereum’s overall market share is still sitting below 10%, reflecting the broader underperformance ETH has experienced relative to BTC for much of 2026. The Ethereum ecosystem remains robust in terms of DeFi TVL and developer activity, but price-wise, the asset continues to play catch-up.
Tron the Only Major Red: Down 1% on the Week
Tron was the lone significant red mark in an otherwise green week for the top assets, finishing down roughly 1%. No single catalyst drove the underperformance — it reflects thin buying interest in TRX relative to higher-profile assets during a risk-on week. For Tron holders, the decline is minor, but the lack of participation in this week’s rally is worth noting. To stay updated on market events, consider using crypto news calendars to track significant developments.
Chart of the Week: Ethena (ENA) Breakout Setup
Every week, one chart stands out from the noise. This week, that chart belongs to Ethena (ENA).
ENA has been building a technically significant structure over the past several weeks. After a sharp drawdown earlier in Q2 2026, the token has been consolidating in a tight range — the kind of coiling price action that often precedes a high-momentum breakout. Volume has been contracting during the consolidation, which is exactly what technical analysts look for before a major directional move.
Key Price Levels to Watch
When analyzing ENA’s current chart structure, three levels define the trade. For those looking to stay updated with the latest market events, consider using crypto news calendars to track significant developments.
Resistance: The upper boundary of the current consolidation range — a confirmed close above this level on strong volume would signal a breakout.
Support: The lower range boundary, which has held on multiple retests, indicating buyers are defending this level.
Invalidation: A daily close below the support zone on elevated volume would invalidate the bullish setup and suggest further downside is likely before any meaningful recovery.
Momentum Context: RSI and Volume Signals
ENA’s Relative Strength Index (RSI) is currently sitting in a neutral-to-bullish zone, having recovered from oversold territory without yet reaching overbought levels. This is the sweet spot for breakout traders — there’s room to run before momentum becomes stretched. Volume during the consolidation has been contracting, which compresses the range and builds energy for a larger move. For those interested in identifying promising cryptocurrencies, here’s a research guide on spotting winning altcoins before the crowd moves.
The confirmation signal to watch is a volume spike accompanying a price close above resistance. Without volume behind the breakout, any move above resistance risks becoming a fakeout. Patient traders will wait for that volume confirmation before entering. Those already positioned from lower levels should be watching the resistance zone closely as a potential partial profit-taking area. For those interested in staying informed, crypto news calendars can be a valuable tool to track market events that may influence volume and price movements.
Is This the Macro Cycle Bottom? What Analysts Are Saying
The question every crypto investor is asking right now is the same one that surfaces at every major inflection point: is this the bottom, or just a relief rally inside a larger downtrend? The honest answer is that no single data point confirms a cycle bottom. But when multiple independent signals align simultaneously, the probability of a significant low being in place increases substantially — and right now, several of those signals are flashing at once. For those looking to stay informed, subscribing to the best crypto newsletters can provide valuable insights.
On-chain data, derivatives positioning, miner behavior, and institutional analyst commentary are all pointing in the same direction. That doesn’t guarantee the bottom is in. But it does mean the risk-reward for strategic accumulation is becoming more favorable than it has been at any point in 2026.
Standard Chartered Calls the End of Crypto Winter
Standard Chartered — one of the few major global banks that has consistently produced rigorous, data-backed crypto research — officially declared this week that the crypto winter is over. Their analysts cited improving macro conditions, stabilizing ETF flows, and Bitcoin’s ability to hold above key structural support levels despite significant selling pressure earlier in June as the primary evidence for their call.
Standard Chartered’s crypto research desk has a notable track record of making early cycle calls, including their early 2023 Bitcoin price targets that were widely dismissed at the time but proved prescient. Their bottom call doesn’t mean prices go straight up from here — but it does carry weight with institutional allocators who follow their research closely, and that institutional attention can become a self-fulfilling dynamic as capital begins to re-enter the market.
Bitcoin Mining Capitulation Signals Historically Mark Bottoms
On-chain data showed clear signs of Bitcoin miner capitulation this week — a phenomenon where miners, squeezed by reduced profitability after the most recent halving cycle, are forced to sell BTC reserves to cover operating costs. Hash rate dropped, miner outflows to exchanges spiked, and the Puell Multiple — a metric that compares daily miner revenue to its 365-day moving average — dipped into the historically significant capitulation zone.
Here’s why this matters: miner capitulation has historically preceded major Bitcoin price recoveries. The logic is straightforward — once the weakest miners are forced out and their selling pressure is exhausted, the supply overhang clears. The miners who remain are profitable at current prices and have no incentive to sell. This dynamic has played out in 2015, 2018, and 2022, each time marking a zone within weeks of the cycle low. The 2026 signal is not identical to past cycles, but the structural similarity is hard to ignore.
RSI at 29.1 — Oversold but Not Yet Confirmed Reversal
At its weekly low earlier in June, Bitcoin’s RSI touched 29.1 — firmly in oversold territory on the daily timeframe. Oversold RSI readings don’t automatically mean prices will reverse, but when combined with miner capitulation data, a CVD flip, and institutional bottom calls, the confluence becomes meaningful. The caution here is that RSI can remain oversold longer than expected in genuine bear markets. The relief rally Bitcoin has staged since that low is an encouraging sign that 29.1 may have marked a local — and potentially macro — bottom, but confirmation requires higher highs and higher lows on the weekly chart before the thesis is fully validated.
Major Market Developments That Moved Prices This Week
Beyond price action and chart setups, several fundamental developments shaped how the market traded this week. From ETF flows reversing to US policy shifts and tightening global regulation, here’s the news that actually mattered.
ETF Outflows Hit Record Levels Before Buyers Stepped In
Spot Bitcoin ETFs experienced significant outflows in the first half of June, with several consecutive days of net redemptions that spooked retail sentiment and put additional selling pressure on BTC spot markets. The outflows were driven by macro uncertainty, with institutional managers reducing risk exposure across the board — crypto included. At the peak of the outflow streak, daily net redemptions from US-listed spot Bitcoin ETFs reached levels not seen since the products launched.
The reversal came mid-week, coinciding with the improvement in geopolitical sentiment and oil price retreat. Net flows flipped positive, and the pace of buying accelerated into the weekend. This ETF flow reversal was one of the clearest signals that institutional sentiment had shifted — these are not retail traders reacting to Twitter sentiment, but fund managers making deliberate allocation decisions based on macro and risk models.
Venture Capital Activity Continues to Shrink
Crypto VC Funding: 2024 vs. 2026 Trend Snapshot
Venture capital investment in crypto and Web3 projects has been in a sustained contraction through the first half of 2026. Deal count and total dollars deployed are both tracking significantly below 2024 peak levels, reflecting a broader risk-off posture among institutional investors and a flight to quality within the crypto venture ecosystem.
The pullback in VC activity has real consequences for the altcoin market. In previous cycles, venture capital functioned as the early-stage funding engine that brought new protocols, tokens, and ecosystems to market — creating the wave of new projects that fueled altcoin seasons. With fewer deals being done and smaller check sizes being written, the pipeline of new high-quality crypto projects launching into the market has thinned considerably.
This isn’t entirely negative. Reduced VC activity means less token supply being unlocked and dumped on retail markets, fewer low-quality projects raising money on hype alone, and a more selective environment where only fundamentally sound projects attract capital. The builders who are securing funding right now are doing so in a highly competitive environment — which tends to produce better projects.
For investors, the VC contraction is a signal to focus on established assets with proven utility and liquidity rather than chasing early-stage token launches. The easy money from buying into anything with VC backing has dried up for now.
The sectors still attracting venture interest despite the broader pullback include AI-integrated blockchain infrastructure, real-world asset (RWA) tokenization platforms, and Bitcoin Layer 2 solutions. These three verticals are where smart money is concentrating — and they’re worth tracking as leading indicators of where the next major narrative cycle may originate.
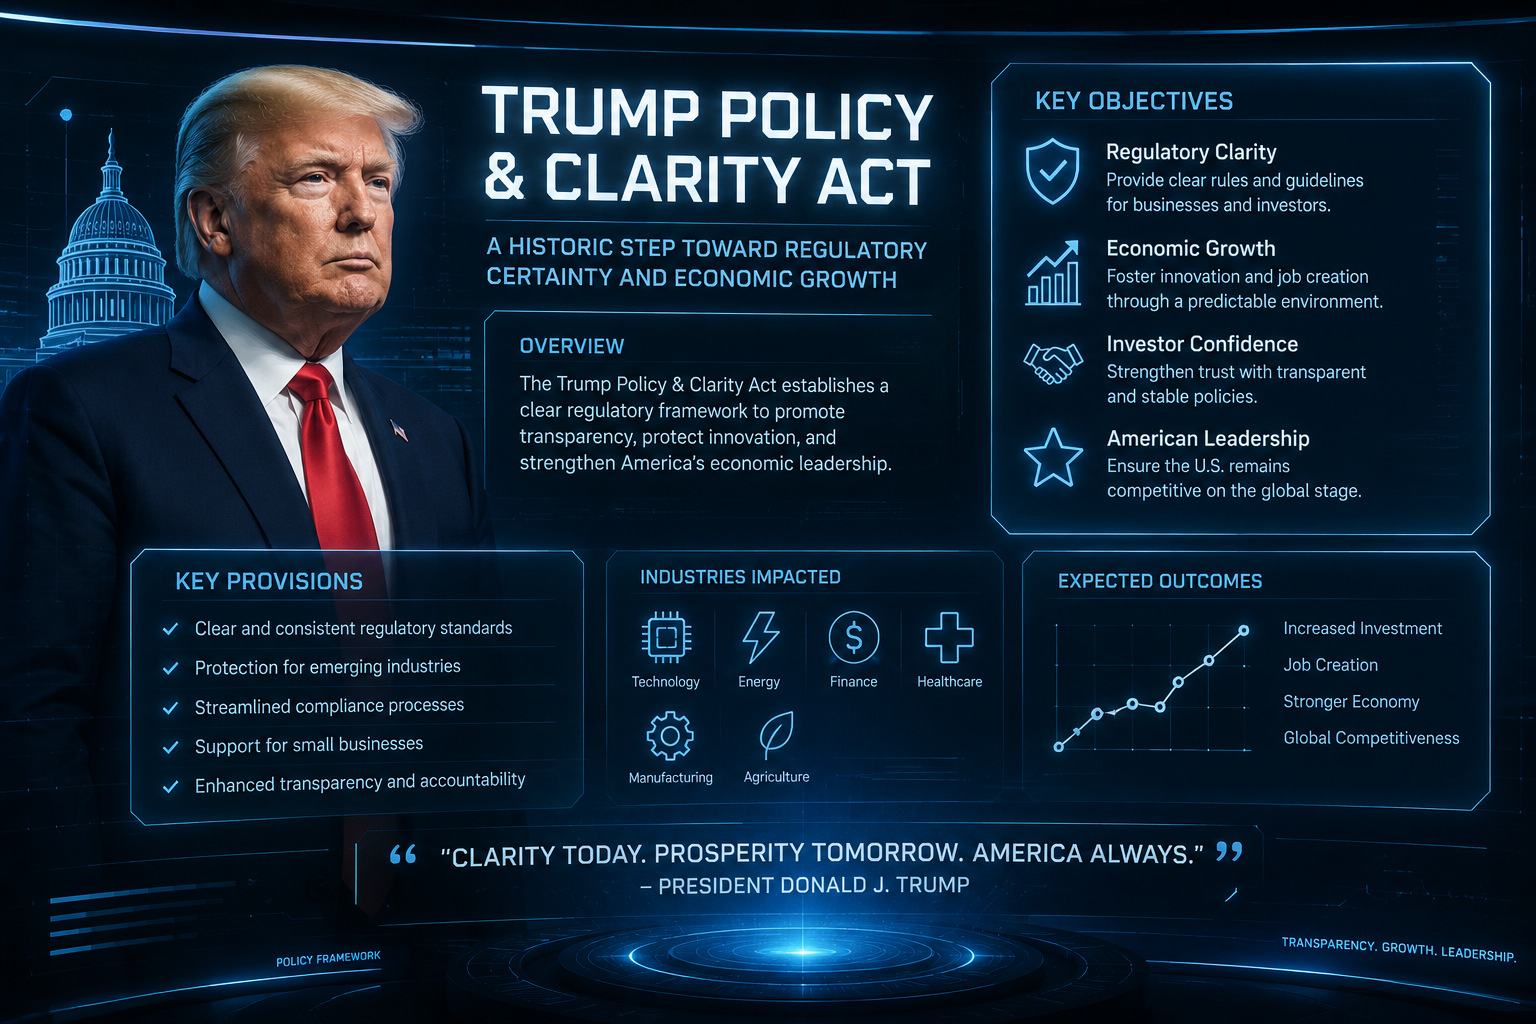
US Policy Overhaul: What Changed and Why It Matters
The US regulatory environment for crypto continued its structural evolution this week. Ongoing legislative developments around digital asset classification, stablecoin frameworks, and exchange oversight are creating a more defined — if not yet fully settled — compliance landscape. For institutional investors who have been waiting for regulatory clarity before making significant allocations, each incremental policy development reduces the perceived legal risk of crypto exposure. The direction of travel in US crypto policy in 2026 is clearly toward structured integration rather than outright restriction, and that shift is a long-term tailwind for the asset class.
Global Regulation Tightening: India and Beyond
India’s crypto regulatory environment tightened further this week, with compliance requirements for domestic exchanges and reporting obligations for traders becoming more stringent. This is part of a broader global trend — regulators from the EU, Southeast Asia, and the Gulf states are all moving toward stricter oversight frameworks simultaneously. The short-term effect is reduced trading activity from participants who are uncertain about compliance obligations. The long-term effect, however, is market legitimization.
Markets that operate within clear regulatory frameworks tend to attract more institutional participation over time. India, in particular, represents a massive untapped crypto market — one of the largest retail investor bases in the world. As the regulatory framework clarifies, the conditions for that latent demand to translate into market participation become more favorable. Regulation is not the enemy of crypto growth; regulatory ambiguity is.
Security Risks Still Active in India’s Crypto Ecosystem
Despite regulatory progress, security incidents continued to impact India’s crypto ecosystem this week. Exchange-level vulnerabilities, phishing campaigns targeting retail investors, and smart contract exploits on DeFi protocols operating in the region were all reported. These incidents serve as a persistent reminder that security hygiene remains a non-negotiable part of participating in crypto markets — regardless of how bullish the macro or technical setup looks.
For Indian investors specifically, the combination of tightening regulation and active security threats creates a complex environment. The practical takeaway is straightforward: use regulated, well-audited platforms, store significant holdings in hardware wallets rather than exchange accounts, enable all available two-factor authentication, and treat any unsolicited investment opportunity with extreme skepticism. The market opportunity in crypto is real — but so are the risks for investors who skip the security fundamentals.
Portfolio Insights: What This Week’s Data Tells Investors
The macro picture and price action this week tell a coherent story — but only if you know how to read the underlying data beneath the surface-level price moves. Bitcoin reclaiming $65,000 and Solana surging 13% are the headlines. The more actionable insights are in the stablecoin data, market cap distribution, and where liquidity is actually sitting right now.
For active investors, this week represents a potential inflection point — not a confirmed bull market resumption, but a meaningful improvement in risk-reward conditions. The key is distinguishing between a structural shift and a relief bounce inside a larger consolidation. Right now, the data supports cautious optimism with selective positioning, not aggressive all-in deployment.
High Stablecoin Dominance Signals the Market Is Still Waiting
Stablecoin dominance — the percentage of total crypto market cap held in stablecoins like USDT and USDC — remains elevated heading into this week. Historically, high stablecoin dominance is a bullish indicator for crypto markets because it represents dry powder sitting on the sidelines. When that capital rotates back into BTC, ETH, and altcoins, it drives sustained price appreciation. The fact that stablecoin dominance hasn’t declined sharply yet tells us that the majority of sidelined capital hasn’t fully committed to this rally. That’s actually constructive — it means there’s still significant buying fuel available if macro conditions continue to improve and investor confidence builds.
$2.16T Total Market Cap — Where Liquidity Is Sitting Right Now
At approximately $2.16 trillion, the total crypto market cap is well below its all-time high range but significantly above the cycle lows. The distribution of that capital matters enormously right now. Bitcoin is absorbing roughly 58% of total market cap, stablecoins are holding a disproportionately large share compared to historical norms, and the remaining capital is spread thinly across thousands of altcoins — with most of the altcoin liquidity concentrated in the top 20 assets. This concentration pattern is consistent with late-bear or early-recovery market structures, where capital defensively clusters in the highest-liquidity assets before gradually rotating outward as confidence returns.
Key Events to Watch in the Week Ahead
The setup heading into the next trading week is unusually event-dense. Here are the specific catalysts and data points that have the highest potential to move crypto markets in the days ahead:
- •US Federal Reserve Communications: Any shift in tone around interest rate timelines will directly impact risk asset sentiment. Watch for Fed speaker appearances and any language around inflation trajectory.
- •Bitcoin Weekly Chart Close: A confirmed weekly close above $65,000 would be the first technical milestone toward validating the bottom thesis. A failure to hold could signal the relief rally has exhausted itself.
- •Spot Bitcoin ETF Flow Data: Daily ETF flow reports from US-listed products will reveal whether this week’s institutional buying is sustained or was a one-time rebalancing event.
- •ENA Price Action: Watch for a high-volume breakout attempt above consolidation resistance. This is the highest-probability altcoin technical setup currently in play.
- •Geopolitical Developments: The US-Iran situation remains fluid. Any deterioration in the peace framework narrative could reverse the macro unlock that drove this week’s rally.
- •Miner Hash Rate Recovery: As weaker miners exit, watch for hash rate to stabilize and begin recovering — a signal that the capitulation phase is ending and the network is strengthening.
Frequently Asked Questions
The questions below represent the most common — and most important — things investors are asking about right now. These aren’t surface-level answers; they’re the context you actually need to make informed decisions in the current market environment. For those interested in more information on navigating complex financial systems, you might find our guide to DeFi protocols helpful.
If you’re new to reading weekly crypto market reports, the FAQ section is often the fastest way to get oriented — start here, then go back through the full analysis above with that context in mind.
Is Bitcoin in a Bull or Bear Market Right Now in 2026?
Based on current data, Bitcoin is best described as being in a late-stage recovery phase rather than a confirmed bull or bear market. BTC is above its most recent cycle lows, it has reclaimed the $65,000 level, and multiple bottom indicators — including miner capitulation signals, CVD flips, and oversold RSI readings — have fired simultaneously. However, Bitcoin remains below its all-time highs and has not yet printed a confirmed higher high on the weekly chart, which is the technical requirement for a formal bull market designation.
Standard Chartered has called the end of crypto winter, and on-chain data supports that thesis directionally. But prudent investors should treat this as a high-probability recovery setup that still requires confirmation — not a guaranteed bull market that justifies maximum risk exposure.
What Does BTC Dominance Above 58% Mean for Altcoins?
BTC dominance above 58% means that capital is still concentrated in Bitcoin rather than flowing into altcoins. In practical terms, this translates to underperformance for most altcoins relative to BTC during this phase of the market. Altcoin seasons — periods where smaller assets dramatically outperform Bitcoin — historically begin when BTC dominance starts declining from elevated levels, typically after Bitcoin has already made its major move and investors rotate profits into higher-risk assets further down the market cap spectrum. Until dominance begins compressing meaningfully, the cleanest risk-adjusted exposure in crypto remains concentrated in BTC and ETH, with selective positions in technically strong altcoins like SOL and ENA rather than broad altcoin baskets.
Why Did Solana Outperform Bitcoin and Ethereum This Week?
Solana’s 13.28% weekly gain versus Bitcoin’s 6.25% reflects a simple dynamic: higher-beta assets amplify directional moves in both directions. When sentiment improves and risk appetite returns, investors who want leveraged exposure to the recovery without using derivatives often rotate into assets like SOL, which historically moves at a multiple of Bitcoin’s percentage gains during risk-on periods. For those interested in keeping up with the latest market trends, subscribing to crypto newsletters can provide valuable insights.
Beyond the beta explanation, Solana also had network-specific tailwinds this week — improving DEX volume, continued developer activity, and growing institutional recognition of Solana’s throughput advantages as a Layer 1 platform. The combination of macro tailwind and network-specific momentum is what drove the outsized weekly gain. Whether SOL can sustain this outperformance depends on whether BTC continues to hold above $65,000 and whether Solana’s on-chain metrics remain strong. For insights on identifying promising digital assets, check out this research guide on spotting winning altcoins.
What Is CVD and Why Does It Matter for Crypto Price Direction?
CVD stands for Cumulative Volume Delta — a metric that tracks the running total of buying volume minus selling volume across perpetual futures markets. When CVD is negative, it means sellers have been more aggressive than buyers over the measured period. When CVD is positive and rising, buyers are in control. The significance of the shift from -$770 million to +$182 million this week is that it represents nearly $1 billion in net buying pressure entering the market in a compressed timeframe.
CVD matters because it separates price moves driven by genuine buyer conviction from those driven purely by short liquidation cascades. A price increase on a negative or flat CVD might just be shorts getting squeezed — that kind of move tends to fade quickly. A price increase accompanied by a strong positive CVD flip indicates that real buyers are accumulating at current prices, which is a more durable foundation for sustained upside. This week’s CVD flip is one of the more credible signals that the recovery has real demand behind it.
Should I Buy Crypto Now or Wait for More Market Confirmation?
Signal Tracker: Current Confirmation Status
✓ Miner capitulation signal fired
✓ Perpetual CVD flipped positive (+$182M)
✓ RSI reached oversold (29.1) and recovered
✓ Standard Chartered called cycle bottom
✓ ETF outflows reversed to net inflows
✗ Weekly higher high not yet confirmed on BTC chart
✗ BTC dominance not yet declining (altcoin season not started)
✗ Macro rate cut confirmation still pending
Five of eight major confirmation signals have fired. Three remain outstanding — and those three are the ones that matter most for sizing a position with real conviction. The framework above isn’t a buy or sell recommendation; it’s a structured way to assess where we are in the confirmation process before committing capital.
For investors who already hold crypto, this environment supports maintaining current positions and potentially adding to high-conviction assets like BTC and ETH on any pullbacks toward support. The risk of holding through this phase is manageable given the multiple bottom signals that have already fired.
For investors currently sitting entirely in cash or stablecoins, the data supports beginning to build initial positions now — not deploying everything at once, but starting to establish exposure through a structured entry plan. Dollar-cost averaging into BTC and ETH over the next four to six weeks rather than making a single lump-sum entry is the most risk-managed approach given the three outstanding confirmation signals.
For speculative positions in altcoins, the playbook is more selective. BTC dominance above 58% means broad altcoin exposure is premature. Focus on assets with strong technical setups — ENA is the standout this week — and assets with clear network-specific catalysts rather than just riding macro momentum. Keep altcoin position sizes smaller than you would in a confirmed altcoin season, and define your invalidation levels before entering.
The worst decision right now is paralysis. Waiting for perfect confirmation in crypto markets means buying after the majority of the move has already happened. The signals available this week are sufficient to justify a measured, risk-managed entry strategy — not a maximum conviction all-in bet, but a disciplined start to building exposure for the next phase of the cycle.
For ongoing weekly market analysis, breakout setups, and portfolio insights to help you navigate every phase of the crypto cycle, Coinposters Crypto Market Report delivers the data-driven reporting serious investors rely on to stay ahead of the market.
DISCLAIMER: This crypto market report June 15 2026 is for informational purposes only and does not constitute financial, investment, legal, or trading advice. The analysis provided in this crypto market report June 15 2026 reflects market data and technical analysis accurate at the time of publication, but market conditions evolve rapidly. Always conduct your own research (DYOR), verify information from multiple sources, understand that your optimal trading or investment strategy may differ significantly from the recommendations or analysis provided, and never make investment decisions based solely on any single report or analyst opinion. Past performance from crypto investments does not guarantee future results. The assets, price levels, and chart setups mentioned in this crypto market report June 15 2026 are referenced for example and educational purposes and do not represent endorsements or investment recommendations. Cryptocurrency trading and investing carry substantial risk of loss, including total loss of capital. Before committing any funds to crypto markets, ensure you fully understand the specific risks involved, your personal risk tolerance, your financial situation, and your local regulations around cryptocurrency trading. If you are uncertain about any aspect of crypto investing, consult with qualified financial professionals before committing capital.