Coinposters
On-Chain Analysis vs Fundamental Analysis: Which Finds Most Undervalued Tokens?

Research Strategy Guide · 2026
On-Chain Analysis
vs Fundamental
Analysis: Which
Finds the Most
Undervalued
Crypto Tokens?
Finding undervalued crypto tokens before everyone else does is the difference between life-changing returns and buying the top — and most traders are using only half the tools available to them.
Crypto Insights at a Glance
- →On-chain analysis and fundamental analysis are two distinct methods for finding undervalued crypto tokens — each with unique strengths and blind spots.
- →Key on-chain metrics like active addresses, exchange outflows, and wallet accumulation patterns can signal early buying opportunities before the broader market catches on.
- →Fundamental analysis evaluates a token’s intrinsic value using market cap, tokenomics, TVL, and team credibility — but it can miss short-term price signals.
- →The most reliable strategy combines both methods — using fundamentals to build a shortlist and on-chain data to confirm market sentiment.
- →Specific metric ratios like Market Cap to TVL let experienced traders quickly filter out overvalued tokens from genuinely undervalued opportunities.
Table of Contents
- Most Investors Miss Undervalued Tokens Because They Only Use One Method
- What Is Fundamental Analysis in Crypto?
- What Is On-Chain Analysis in Crypto?
- Fundamental Analysis vs On-Chain Analysis: A Direct Comparison
- How to Combine Both Methods to Find Undervalued Tokens
- Real Metrics to Watch When Hunting Undervalued Tokens
- Neither Method Alone Is Enough — Here Is What Actually Works
- Frequently Asked Questions
The debate between on-chain analysis vs fundamental analysis isn’t really about which one is better. It’s about understanding what each method reveals and what it hides. Traders who master both have a significant edge in any market condition. For those looking to build the right research toolkit, our guide to the best crypto research platforms covers the tools that make both approaches possible. CoinGecko also provides a powerful free starting point, offering access to on-chain data, market metrics, and token fundamentals all in one place.
Most Investors Miss Undervalued Tokens Because They Only Use One Method
Most retail investors fall into a trap: they either chase price charts or read whitepapers, but rarely do both with any real discipline. Technical chart analysis alone tells you what a price is doing right now, not what a token is actually worth. Fundamental analysis tells you what a project is worth on paper, but not necessarily when the market will agree with that valuation.
On-chain analysis sits in a unique position between the two. It doesn’t care about what a team promises in a roadmap, and it doesn’t care about candlestick patterns. It reads what is actually happening on the blockchain — real money moving between real wallets in real time.
The investors consistently finding undervalued tokens early aren’t smarter. They’re simply cross-referencing more data points. A token can look fundamentally strong but show on-chain data suggesting large holders are quietly selling. That single signal, missed by someone relying on fundamentals alone, could be the difference between a 3x gain and a 40% loss.
What Is Fundamental Analysis in Crypto?
Fundamental analysis in crypto is the process of evaluating a token’s intrinsic value by examining everything known about the project. This includes the team behind it, the problem it solves, its competitive advantage, and the financial metrics that determine whether it is priced fairly relative to its actual utility and adoption.
Unlike stocks, crypto tokens don’t have earnings per share or price-to-earnings ratios in the traditional sense. So analysts have adapted a set of crypto-native metrics that serve a similar purpose — giving investors a way to determine whether a token is overvalued, undervalued, or fairly priced at current market levels.
The Core Metrics Fundamental Analysis Measures
A solid fundamental analysis of any crypto token covers both quantitative data you can pull from a data aggregator and qualitative factors that require deeper research into the project itself.
Core Fundamental Analysis Metrics — Crypto 2026
| Metric | What It Tells You | Why It Matters |
|---|---|---|
| Market Capitalization | Total value of all circulating tokens | Indicates size and risk level of the asset |
| Total Value Locked (TVL) | Capital deposited in protocol smart contracts | Measures real usage and trust in the ecosystem |
| Tokenomics | Supply schedule, distribution, and inflation rate | Reveals long-term sell pressure risks |
| Trading Volume | 24-hour transaction value across exchanges | Shows liquidity and market interest |
| Whitepaper & Use Case | Project’s technical purpose and solution | Determines if there is genuine real-world demand |
| Team & Roadmap | Credibility and development trajectory | Assesses execution risk of the project |
| Community Size | Engagement on social and governance channels | Reflects organic growth and network effects |
Each of these metrics on its own is incomplete. A token with a strong team but weak tokenomics — say, a massive unlocking schedule coming in six months — can collapse in price regardless of how good the technology is. Fundamental analysis requires you to hold all of these variables simultaneously.
How to Calculate a Token’s Intrinsic Value
There’s no single formula for intrinsic value in crypto the way there is in traditional finance. Instead, analysts compare a token’s Market Cap to its TVL ratio, assess its fully diluted valuation (FDV) against current usage metrics, and benchmark it against similar projects in the same sector. If a DeFi token has a Market Cap to TVL ratio below 1.0, it often signals the market is underpricing the protocol relative to the capital it actually controls — a classic undervaluation signal.
Where Fundamental Analysis Falls Short
The core weakness of fundamental analysis in crypto is timing. A token can be fundamentally strong for months or even years while its price stagnates or declines. Markets are irrational in the short term, and without a complementary method to gauge actual investor behavior and capital flows, fundamental analysis alone can leave you holding a “great project” that the market simply isn’t ready to price correctly yet.
What Is On-Chain Analysis in Crypto?
On-chain analysis is the practice of reading verified, publicly available blockchain data to understand how capital and tokens are actually moving — not how analysts think they should be moving. Every transaction, wallet balance, and smart contract interaction is permanently recorded on the blockchain, creating a transparent financial dataset that has no equivalent in traditional markets. For a deeper primer, CoinGecko’s on-chain analysis guide covers the fundamentals clearly.
How On-Chain Data Differs From Traditional Market Data
Traditional market data — stock prices, volume, earnings reports — is filtered through intermediaries and often delayed. On-chain data is raw and real-time. When a whale wallet moves 50,000 ETH to a cold storage address, that transaction is visible to anyone within seconds of confirmation. This transparency gives on-chain analysts a direct window into the behavior of the largest and most sophisticated market participants, long before those moves show up in price action.
Key On-Chain Metrics That Signal Undervalued Tokens
Not all on-chain metrics carry equal weight when searching for undervalued tokens. The most actionable signals tend to be those that reflect genuine accumulation, growing network usage, or reduced sell pressure — all signs that a token may be building a base before a significant price move.
On-Chain Metrics Experienced Analysts Track Most Closely
- ◆Active address growth — Rising unique users suggesting real adoption is expanding
- ◆Exchange outflows — Tokens leaving exchanges indicate holders moving to cold storage rather than preparing to sell
- ◆Supply distribution shifts — Growing wallet counts in mid-tier holding ranges suggest retail accumulation
- ◆Volume vs price divergence — High volume with flat or declining price often precedes a breakout
Tools Used for On-Chain Analysis: Glassnode and Beyond
Three platforms dominate the on-chain analysis space for crypto investors at every level. Glassnode is the most comprehensive, offering deep metrics like SOPR (Spent Output Profit Ratio), MVRV Z-Score, and realized cap data — mostly for Bitcoin and Ethereum with growing altcoin coverage. Dune Analytics allows users to write custom SQL queries directly against blockchain data, making it a favorite among DeFi-focused researchers who need protocol-specific metrics. Nansen adds a layer of wallet labeling intelligence, identifying known exchange wallets, venture capital funds, and smart money addresses so you can track where sophisticated capital is actually flowing in real time.
Fundamental Analysis vs On-Chain Analysis: A Direct Comparison
Both methods are trying to answer the same question: is this token worth more than what the market is currently pricing it at? But they approach that question from completely different angles. Fundamental analysis looks at what a project should be worth based on its utility, team, and adoption metrics. On-chain analysis looks at what the market is actually doing with the token right now — and those two realities can diverge significantly.
Which Method Is Better at Spotting Undervalued Tokens Early
On-chain analysis has a genuine timing advantage. When large wallet holders begin accumulating a token quietly — moving supply off exchanges and into cold storage — that signal shows up in on-chain data days or weeks before it registers in price. Fundamental analysis can identify a strong project, but it cannot tell you when accumulation is happening or when smart money is positioning ahead of a catalyst. For early entry, on-chain data wins.
Which Method Carries More Risk of Misleading Signals
Misleading Signal Risks — Both Methods
- ⚠Fundamental analysis risk: A project can look exceptional on paper and still fail due to poor market timing, competitive disruption, or a bear market that indiscriminately reprices all assets downward.
- ⚠On-chain risk: Whale wallets can manipulate visible accumulation patterns, creating false signals of institutional interest to attract retail buyers before dumping.
- ⚠TVL inflation risk: Total Value Locked figures can be artificially inflated through circular lending strategies, making a project look more adopted than it actually is.
- ⚠Exchange data gaps: On-chain analysis struggles with tokens held on centralized exchanges, where internal transfers don’t appear on the public blockchain at all.
- ⚠Qualitative blind spots: On-chain data cannot assess team credibility, whitepaper quality, or whether a project’s roadmap is realistic — gaps that fundamental analysis is specifically designed to fill.
The real risk isn’t choosing the wrong method — it’s over-relying on either one. Fundamental analysis without on-chain confirmation can leave you in strong projects with no near-term price catalyst. On-chain analysis without fundamental context can lead you into technically active tokens that are fundamentally hollow. For a comprehensive approach, consider using the best crypto research platforms to gather insights from both layers simultaneously.
A token with rising active addresses and exchange outflows looks bullish on-chain. But if its tokenomics include a 40% team token unlock scheduled for next quarter, the fundamental picture tells a completely different story that the on-chain data simply cannot see. For a comprehensive understanding of the financial ecosystem, you might want to explore the crypto-friendly banks across different regions.
Neither method is inherently more dangerous — but on-chain data tends to generate more false positives in low-liquidity altcoin markets, where a single wallet’s activity can skew metrics that would require thousands of participants to move meaningfully on larger assets like Bitcoin or Ethereum.
How to Combine Both Methods to Find Undervalued Tokens
The most effective approach to finding undervalued tokens isn’t a choice between fundamental and on-chain analysis — it’s a sequential process where each method filters and validates what the other reveals. Think of it as a two-stage funnel: fundamentals narrow the universe of tokens worth investigating, and on-chain data confirms whether the market is ready to move.
1. Start With Fundamentals to Build a Shortlist
Begin by screening tokens using data aggregators like CoinGecko or CoinMarketCap. Filter for projects with a Market Cap to TVL ratio below 1.5 in the DeFi sector, a fully diluted valuation that isn’t more than 5x the current market cap (which would indicate massive future dilution risk), and a circulating supply that represents at least 40% of the total supply to avoid heavy unlock pressure.
From there, go qualitative. Read the whitepaper — not the summary, the actual document. Check whether the team is publicly identified with verifiable track records. Review the project’s GitHub activity to confirm active development. A project with 200+ commits in the last 90 days signals ongoing building, while a dead repository is a red flag no matter how compelling the pitch deck looks. This process should consistently get you down to a shortlist of five to ten tokens worth analyzing further.
2. Use On-Chain Data to Confirm Market Sentiment
Once you have a shortlist of fundamentally sound tokens, open Glassnode, Nansen, or Dune Analytics and start checking the behavioral signals. Look specifically for exchange outflow trends over the past 30 to 90 days — consistent outflows mean holders are accumulating, not preparing to sell. Check active address growth to confirm that real user adoption is increasing alongside or ahead of price. On Nansen, filter for smart money wallet activity on your shortlisted tokens to see whether sophisticated investors are quietly building positions before any public narrative has formed around the token.
3. Cross-Reference Both Signals Before Entering a Position
A token earns serious consideration only when both signals align. Strong fundamentals plus confirming on-chain accumulation patterns is the combination that historically precedes the most significant price moves. If fundamentals are strong but on-chain data shows exchange inflows rising — meaning tokens are moving onto exchanges, a classic pre-sell signal — that’s a reason to wait. Patience at this stage is not a missed opportunity; it’s risk management.
Real Metrics to Watch When Hunting Undervalued Tokens
Beyond the general framework, there are specific metrics that experienced crypto analysts return to repeatedly because they have demonstrated consistent predictive value. These aren’t obscure indicators — they’re available on mainstream platforms and require no coding knowledge to access and interpret.
Market Cap to Total Value Locked Ratio
Market Cap / TVL Ratio — Interpretation Guide
Formula: Token Market Capitalization ÷ Total Value Locked in Protocol Smart Contracts
- Below 1.0Market is pricing the token below the capital actually deployed in the protocol. Historically a strong undervaluation signal for DeFi tokens.
- 1.0 – 3.0Fair value range for most established DeFi protocols with proven product-market fit.
- Above 5.0Market is pricing significant future growth into the token. Higher risk of correction if growth expectations aren’t met.
The Market Cap to TVL ratio is one of the most direct undervaluation signals available for DeFi tokens specifically. It compares what the market says a protocol is worth against the actual capital users have trusted it to hold and manage. A low ratio doesn’t automatically mean buy — you need to verify that the TVL isn’t artificially inflated through incentivized liquidity programs that will disappear the moment rewards dry up.
Protocols like Uniswap, Aave, and Curve have historically traded at Market Cap to TVL ratios that reflected genuine organic usage, making their valuation comparisons meaningful. Newer protocols with aggressive liquidity mining programs can show misleadingly high TVL that masks an underdeveloped user base.
Always cross-reference TVL trends over time, not just the current snapshot. A protocol whose TVL has grown consistently over six months without a corresponding spike in token incentives is demonstrating the kind of organic adoption that fundamental analysis is specifically designed to identify and reward.
“Wallet accumulation data is particularly powerful because it reflects actual financial commitment, not opinion. Real money moving to cold storage is a fundamentally different signal from any analyst’s price target.”
Wallet Accumulation Patterns Among Large Holders
Wallet Accumulation Signals — What to Watch
- ◆Rising holder count in the 1,000–10,000 token range — Indicates growing retail accumulation, often a precursor to broader market attention
- ◆Declining exchange balance over 30+ days — Tokens leaving exchanges consistently suggest long-term holders are removing supply from the liquid market
- ◆Increase in wallets holding for 6+ months — Rising long-term holder supply during price stagnation is a classic undervaluation signal on Glassnode
- ◆Smart money wallet entries on Nansen — When VC or high-performance trader wallets accumulate, a price move frequently follows within 2–8 weeks
- ◆Decrease in top 10 wallet concentration — Supply decentralizing away from largest holders reduces manipulation risk and signals healthier distribution
Wallet accumulation data is particularly powerful because it reflects actual financial commitment, not opinion. When a wallet moves significant capital into a token and transfers it to cold storage, that holder has made a conviction bet with real money — a signal fundamentally different from any analyst’s price target or community sentiment score.
The combination of declining exchange balances and rising long-term holder supply, occurring simultaneously during a period of flat or declining prices, is one of the most reliable setups for identifying tokens that are being quietly accumulated ahead of a major move. This pattern appeared in Ethereum’s on-chain data during the accumulation phase of late 2020, months before ETH’s price broke out from the $400 to $600 range it had traded in for weeks.
Use these accumulation signals as confirmation tools rather than standalone buy signals. A token showing strong wallet accumulation patterns but weak fundamentals — poor tokenomics, unverified team, or negligible real-world usage — is still a speculative bet regardless of what the wallets are doing.
Exchange Inflows and Outflows as Sell Pressure Indicators
Exchange inflows and outflows are among the most direct behavioral signals available in on-chain analysis. When tokens move onto exchanges in large quantities, it typically means holders are preparing to sell — increasing liquid supply and creating downward price pressure. When tokens move off exchanges into private wallets or cold storage, the opposite is true: holders are removing supply from the market, reducing sell pressure and signaling long-term conviction.
Sustained exchange outflows over a 30 to 90 day period, especially during price consolidation, are one of the clearest undervaluation signals available. The market price hasn’t moved, but the underlying supply dynamics are tightening. When a catalyst eventually arrives — a protocol upgrade, a partnership announcement, or a broader market shift — the reduced liquid supply amplifies the price response dramatically.
Watch for divergences specifically. If a token’s price is declining while exchange outflows are simultaneously increasing, large holders are buying the dip and removing those tokens from the market. That divergence between price action and on-chain behavior is exactly the kind of signal that gets missed by traders relying solely on chart patterns or fundamental reports.
Token Velocity and Its Impact on Long-Term Value
Token velocity measures how frequently a token changes hands within a given time period. High velocity means tokens are being rapidly traded rather than held — which tends to suppress long-term price appreciation because there’s no sustained accumulation pressure building. Low velocity, by contrast, signals that holders are treating the token as a store of value rather than a trading instrument, reducing circulating supply organically over time. For undervalued token research, declining velocity during a price consolidation period is a constructive signal. It means the speculative traders have largely exited, leaving behind a holder base with stronger conviction and longer time horizons — the kind of composition that creates more stable price floors and more explosive moves when positive catalysts arrive.
Neither Method Alone Is Enough — Here Is What Actually Works
“The traders consistently finding undervalued tokens before the market aren’t choosing between fundamental and on-chain analysis — they’re running both simultaneously and only acting when both signal the same opportunity.”
CoinPosters · Research Strategy Guide 2026
Fundamentals define the quality of the asset. On-chain data defines the timing of the entry. Together, they create a filter that eliminates most of the noise that leads retail investors into bad trades at the wrong moment. Use CoinGecko for the fundamental screening layer, Glassnode or Nansen for on-chain confirmation, and only commit capital when both layers of the analysis are pointing in the same direction.
Frequently Asked Questions
Here are the most common questions traders ask when learning to apply both fundamental and on-chain analysis to find undervalued crypto tokens.
What Is the Difference Between On-Chain Analysis and Fundamental Analysis in Crypto?
Fundamental analysis evaluates what a token should be worth based on the project’s technology, team, tokenomics, use case, and adoption metrics. On-chain analysis evaluates what is actually happening on the blockchain right now — how capital is moving, where tokens are being held, and whether large investors are accumulating or distributing their positions.
The key distinction is that fundamental analysis is largely forward-looking and qualitative in nature, while on-chain analysis is real-time and purely behavioral. A fundamental analyst reads a whitepaper and evaluates a roadmap. An on-chain analyst reads wallet movements and exchange flow data. Both are trying to identify mispriced assets, but they’re using completely different evidence to reach their conclusions.
In practice, the most effective approach treats them as sequential filters rather than competing methodologies. Fundamental analysis narrows the universe of tokens worth investigating. On-chain analysis confirms whether the market is actually beginning to recognize that value — and whether the timing for an entry is favorable.
Quick Comparison: Fundamental vs On-Chain Analysis
Fundamental Analysis
Data: Whitepapers, team, tokenomics, TVL, market cap
Time Horizon: Medium to long-term (months to years)
Best For: Identifying quality projects the market has underpriced
Weakness: Cannot predict timing of price recognition
On-Chain Analysis
Data: Blockchain transactions, wallet balances, exchange flows
Time Horizon: Short to medium-term (days to months)
Best For: Confirming accumulation and detecting smart money positioning
Weakness: Cannot assess project quality or team credibility
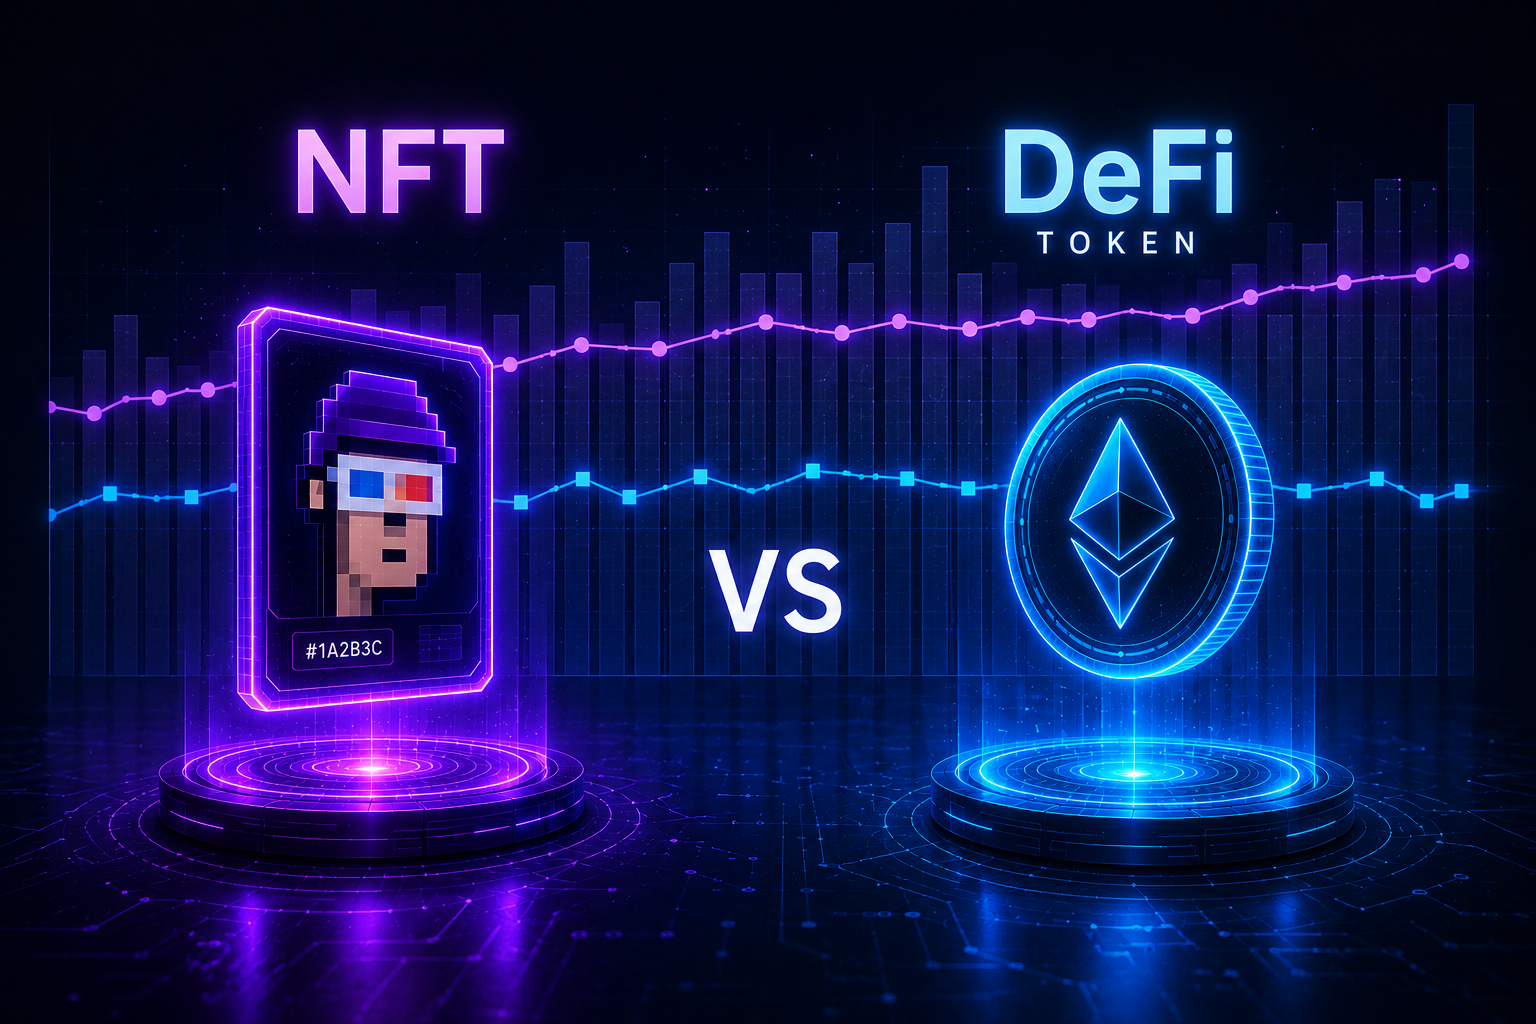
Neither method replaces the other. The goal is to find tokens where both analyses are simultaneously pointing toward undervaluation — strong fundamentals paired with on-chain evidence that sophisticated investors are already quietly positioning ahead of a price move. For more context, explore the differences between altcoin investing vs DeFi investing.
Can On-Chain Analysis Alone Identify Undervalued Tokens?
On-Chain Signal Reliability by Token Type
- ◆Bitcoin & Ethereum: Highly reliable — large holder base, deep liquidity, minimal manipulation risk
- ◆Large-Cap Altcoins (top 50): Moderately reliable — enough wallet diversity to reduce single-actor distortion
- ◆Mid-Cap Altcoins (top 51–200): Require fundamental cross-referencing — concentration risk increases meaningfully
- ◆Small-Cap & Micro-Cap Tokens: Highly unreliable alone — a single whale can simulate accumulation patterns to attract retail buyers before exiting
On-chain analysis alone can surface interesting candidates, but it cannot confirm whether those candidates are worth the risk. A token can show textbook accumulation patterns — exchange outflows, rising long-term holder supply, declining velocity — while simultaneously having fundamentals that guarantee eventual failure. Inflationary tokenomics, anonymous teams with no verifiable track record, and zero genuine user adoption are all factors that on-chain data simply cannot detect.
The manipulation risk in smaller tokens is a particularly serious limitation. In low-liquidity markets, a single large wallet can systematically move tokens off exchanges into secondary wallets it controls, creating the appearance of organic accumulation. Use on-chain analysis as a confirmation tool, not a discovery engine. Let fundamental screening identify the tokens worth watching, then use on-chain data to determine whether the market is beginning to agree with your fundamental thesis.
What Are the Best On-Chain Analysis Tools for Beginners?
Glassnode is the most beginner-accessible professional on-chain platform, offering a free tier that includes core metrics like exchange inflows and outflows, active addresses, and basic holder distribution data for Bitcoin and Ethereum. CoinGecko’s on-chain data section provides token-level metrics without requiring any technical setup. Nansen offers a wallet-labeling layer that lets beginners simply follow wallets already identified as smart money, venture capital funds, or exchange-controlled addresses. For DeFi-specific research, DeFiLlama provides free TVL tracking across hundreds of protocols, making it the fastest tool for Market Cap to TVL ratio screening at scale.
What Fundamental Metrics Matter Most When Evaluating a Token’s Value?
The three metrics that carry the most predictive weight in fundamental analysis are the Market Cap to TVL ratio (for DeFi tokens), the Fully Diluted Valuation to Market Cap ratio (which reveals future dilution risk), and the circulating supply percentage relative to total supply. A token trading at a Market Cap to TVL ratio below 1.0 with a circulating supply above 50% of total supply and a team unlock schedule that has already largely completed represents a fundamentally low-risk setup. Beyond those quantitative metrics, GitHub commit frequency, verifiable team identity, and the presence of genuine third-party audits on smart contracts are the qualitative factors that most reliably separate sustainable projects from projects that will eventually collapse regardless of short-term price performance.
How Do I Know if a Token Is Undervalued and Not Just Declining in Price?
Undervalued vs. Declining — Key Distinguishing Signals
Undervalued Token
- Price declining while exchange outflows increasing
- Long-term holder supply rising
- Active addresses growing
- Market Cap/TVL below sector average
Legitimately Declining Token
- Price declining while exchange inflows increasing
- Long-term holder supply falling
- Active addresses declining
- TVL dropping proportionally with market cap
Warning Signs It’s Just Failing
- GitHub activity stalled
- Team wallets showing outflows
- Protocol revenue declining quarter-over-quarter
- Community engagement dropping across governance forums
A declining price alone tells you almost nothing about whether a token is undervalued. Every bear market reprices fundamentally strong assets alongside genuinely failing ones — indiscriminately and often severely. The question isn’t whether the price is falling; it’s whether the underlying adoption and holder behavior metrics are diverging positively from that price decline.
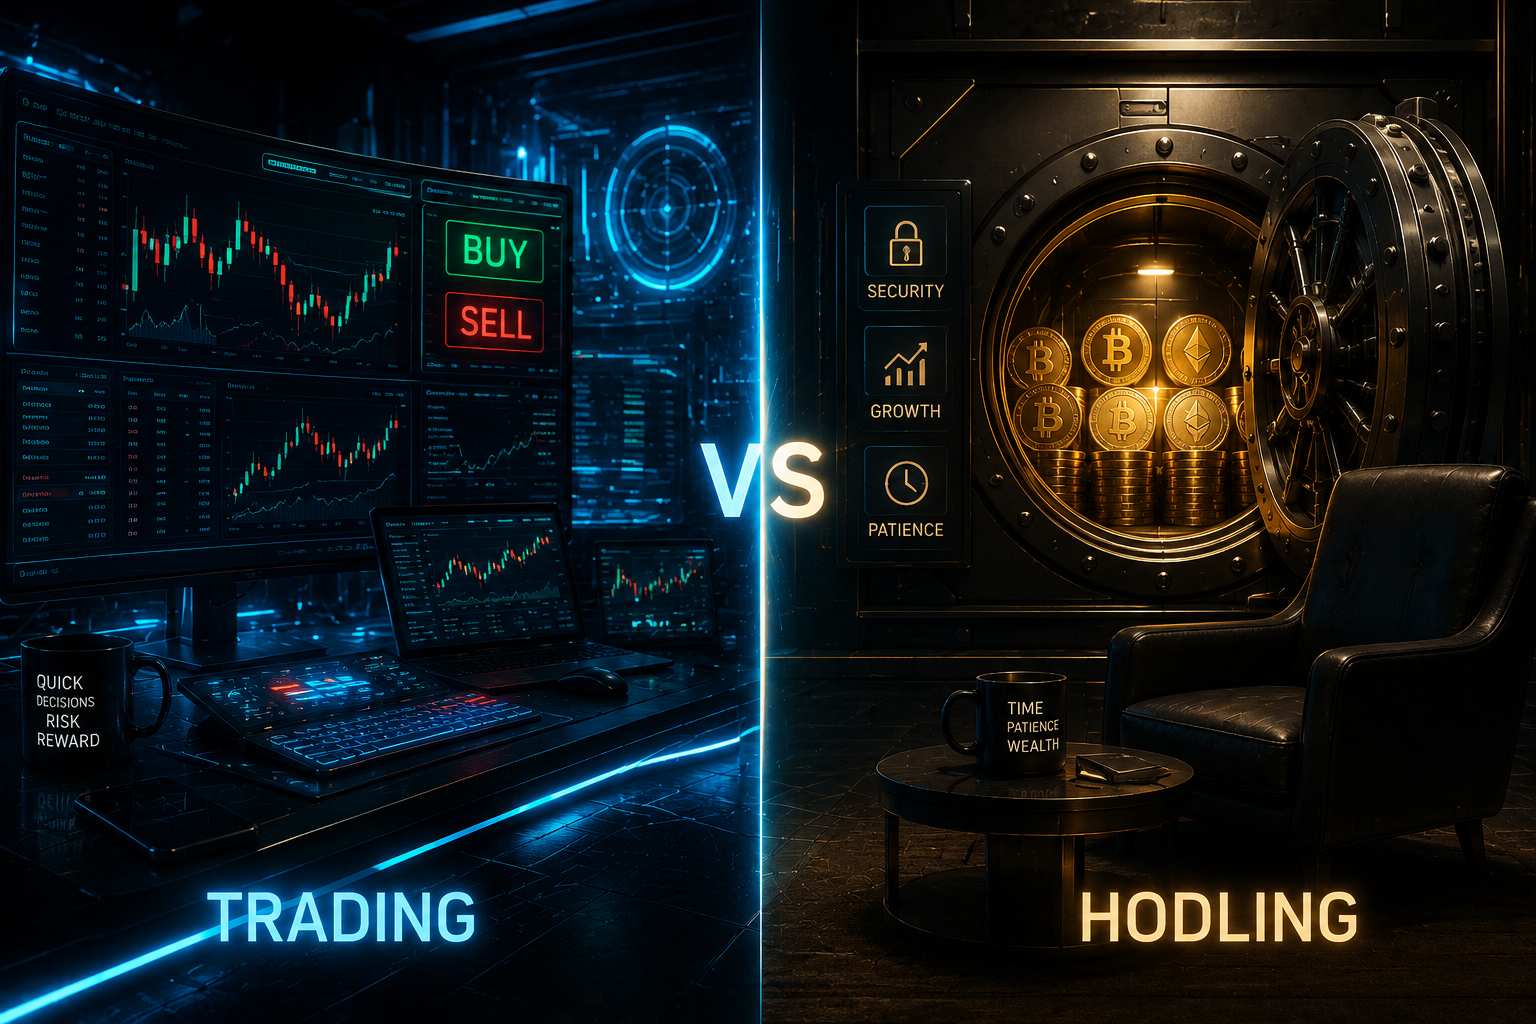
The single most reliable distinction is the behavior of long-term holders during the price decline. If long-term holder supply is rising while price is falling, sophisticated investors with conviction are using the decline to accumulate — a signal that the market is mispricing the asset relative to its fundamental value. If long-term holder supply is falling alongside price, experienced investors are exiting, and the declining price reflects genuine deterioration rather than temporary mispricing. For those considering strategies, understanding the difference between HODLing and active trading can be crucial in navigating such market dynamics.
Protocol revenue is another underutilized filter. A token whose underlying protocol is generating consistent or growing revenue — transaction fees, lending interest, or trading volume — while the token’s market cap declines is a much stronger undervaluation candidate than a token whose price is falling in parallel with declining protocol activity. Revenue data is available for most major DeFi protocols through Token Terminal and DeFiLlama’s revenue tracking dashboard.
Apply the complete filter before drawing any conclusion: falling price plus rising long-term holder supply plus growing active addresses plus Market Cap/TVL below 1.0 plus growing protocol revenue equals a high-confidence undervaluation setup. Any single signal in isolation is insufficient. The convergence of all five creates the kind of asymmetric opportunity that experienced crypto investors are specifically looking for. A token that is simply failing will almost never show all five of those signals simultaneously — trust the weight of evidence across both methodologies rather than any single metric.
Disclaimer
This article is for informational purposes only and does not constitute financial or investment advice. Do Your Own Research (DYOR) before making any cryptocurrency investment or relying on any on-chain or fundamental metric for trading decisions. All crypto investments carry substantial risk of loss. On-chain signals and fundamental metrics can produce false positives and are not guarantees of future price performance. CoinPosters is not responsible for any financial losses arising from actions taken based on the information provided in this article.
CoinPosters
Your guide to navigating crypto in 2026 and beyond.


Latest
Markets
08 Jul 2026
Markets
04 Jul 2026