Coinposters
Bitcoin, Ethereum, BNB Forecast 03/20
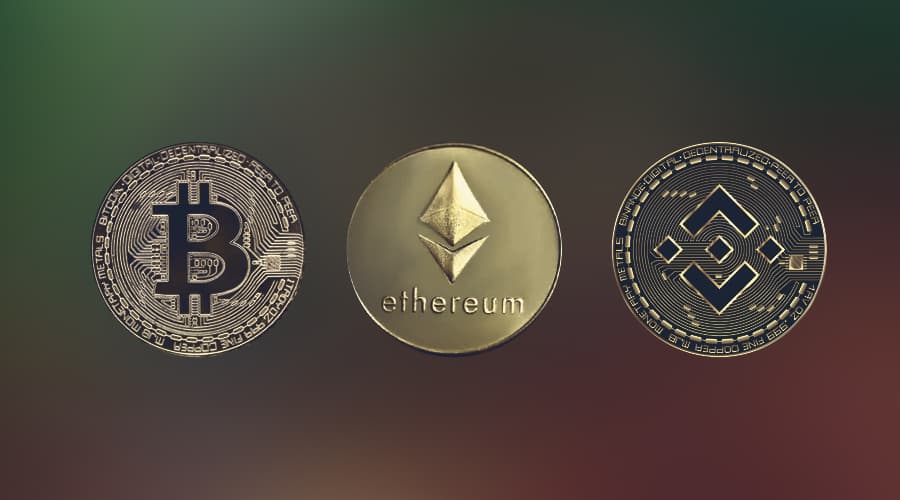
The last six days appear to be the beginning of a new altseason. Many people were ecstatic to see that many projects had made significant progress. This is reflected in the overall crypto market, which has risen by nearly 9% in the last six days. It began the week worth $1.72 trillion but is now worth $1.87 trillion.
The sector has broken a two-week trend in which it opened and closed an intraweek session at the same valuation. Despite the rise in the prices of most altcoins, general market sentiment has not risen significantly. After a brief overview of the industry, let’s take a look at how some Bitcoin, Ethereum, and BNB performed this week.
The previous intraweek session ended with no discernible increase. Bitcoin began at $38,404 and climbed as high as $42,591 before closing at $37,790. Unfortunately, Bitcoin remains in the $37k – $42k range.
This is especially true given that the top coin has been unable to reach $43k after several attempts above $42,000 in the last six days. It began the current week at $37,763 and has increased by nearly 5% since the first day.
On Tuesday, BTC retraced and failed to close in on the greens, resulting in lower trading volume and increased selling pressure. On the third day, Bitcoin saw a lot of trading, dipping to a low of $38,865 and reaching a high of $41,693.
The largest cryptocurrency, on the other hand, is currently experiencing its largest correction this week. As of the time of writing, it was down by 3%. The on-chain data is consistent with the most recent movement in BTC.
It is printing more bearish than bullish action. Nonetheless, we observed that transactions worth more than $100,000 exceeded $153 billion in the last six days (a slight decrease from the previous six days).
Ethereum reached a high of $2,779 and a low of $2,445. The coin saw a lot of trading activity during that time, but it didn’t record any significant gains or losses at the end of that session.
The failure of ETH to emerge from the previous seven-day period with any discernible growth is the result of nearly equal amounts of both opposing influences. Over the last six days, the second-largest cryptocurrency by market cap has experienced more bullish action than bearish.
Starting the week at $2,516, the largest alt saw a significant boost and was off to a solid start. Following that strong start, the asset remained bullish throughout the week, experiencing uptrends for the majority of the time.
Tuesday witnessed only minor improvements compared to Monday, although it concluded with a green candle, indicating a small increase. On Wednesday, the digital asset saw the greatest increase, rising about 6%.
The second-largest coin, like Bitcoin, showed a bullish divergence on the Moving Average Convergence Divergence (MACD) four days ago, signaling the start of the rise. The asset has moved above its Displaced Moving Average (DMA) and is now above it.
In the end, ethereum gained about 15% in the last six days. Despite optimistic signals from numerous indicators, the Relative Strength Index (RSI) is falling following a more than four-day rise due to a reduction in demand concentration.
Over the weekend, BNB returned to its previous pattern of retracement. The candle for the current intraday session is red, indicating that the asset is down a few percent.
Without a doubt, BNB saw larger price rises than the prior year. Like the previous project, it had a bullish divergence on the Moving Average Convergence Divergence (MACD) four days ago, signaling the beginning of the rise.
It also gained stability above its DMA and pivot point. With a minor uptick at the start of the week, the fourth-largest cryptocurrency got off to a solid start. Apart from Tuesday, the coin has been rising for the majority of the current intraweek session.
BNB soared as high as $406, gaining stability above $400 but only for a short while before retracing below it. Unfortunately, the pullback has resulted in a downturn in the RSI, which is currently at 52.


Latest
Bitcoin
09 May 2024
Bitcoin
19 Apr 2024
Bitcoin
16 Jan 2024
Bitcoin
31 Aug 2023
Bitcoin
24 Jun 2023
Bitcoin
24 Jun 2023
Recent News
Bitcoin
24 Jun 2023

Blockchain
24 Jun 2023

Blockchain
24 Jun 2023

Altcoins
24 Jun 2023

Bitcoin
24 Jun 2023

Altcoins
24 Jun 2023
Bitcoin
23 Jun 2023

News
23 Jun 2023