Coinposters
Crypto Market Report June 29, 2026: Extreme Fear on The Back of Steep June Liquidations
Bitcoin fell below $60,000 for the first time since 2024 this week, driven by hot inflation data, record ETF outflows, and stress in Strategy’s capital structure, pushing the Crypto Fear and Greed Index into Extreme Fear even as options and carry markets sent conflicting signals about what comes next.
Article at a Glance: What Happened to Crypto Markets This Week
This crypto market report for June 29, 2026 covers the sharpest week of the year for digital assets:
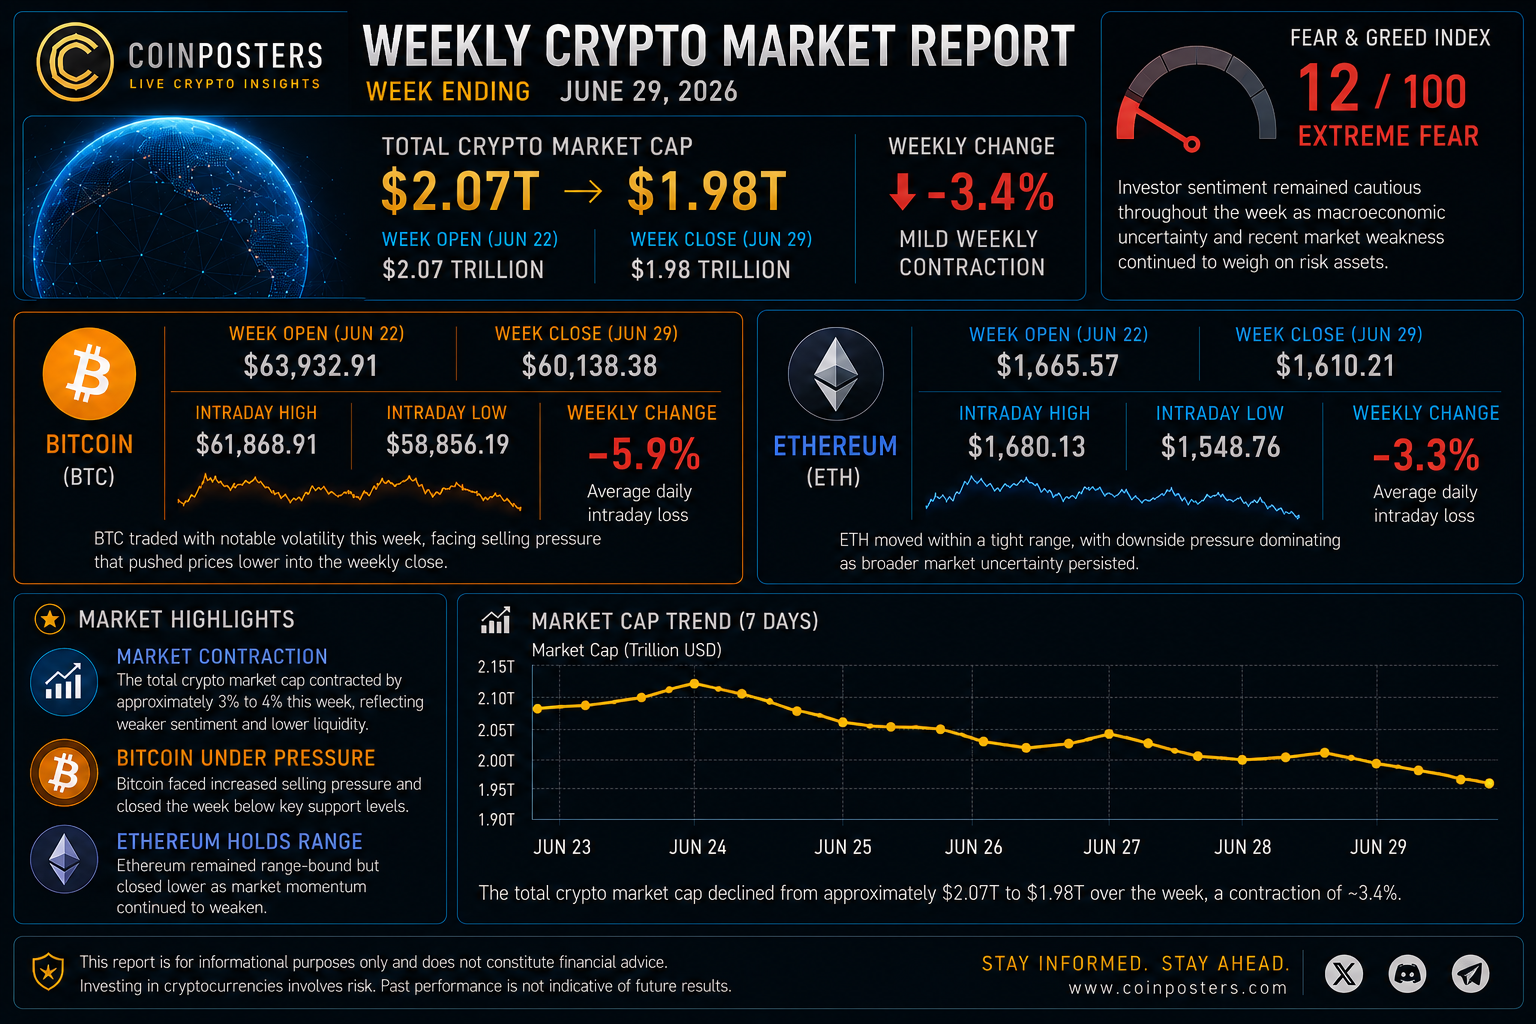
- Bitcoin broke below $60,000 on June 25, 2026, its lowest level since 2024, closing the week near $58,980, down roughly 8%.
- A hotter-than-expected May PCE print reinforced higher-for-longer rate expectations, triggering risk-off selling across crypto and equities alike.
- Strategy’s STRC preferred stock hit all-time lows near $72, adding institutional uncertainty that created a self-reinforcing pressure loop on Bitcoin’s price.
- ETF outflows extended their multi-week streak, with some data suggesting corporate treasury activity may have turned net-selling for the first time in 2026.
- Carry markets stayed surprisingly orderly, find out why that divergence between volatility and leverage could be the most important signal for what comes next.
Table of Contents
- Bitcoin Fell Below $60,000 for the First Time Since October 2024
- What Triggered the June 2026 Crypto Selloff
- June Liquidations By The Numbers
- Options Markets Repriced Sharply to Reflect Downside Risk
- Carry Markets Stayed Relatively Calm Despite the Chaos
- 3 Key Levels and Events That Will Define BTC’s Next Move
- What Could Actually Turn This Market Around
- Regulatory Developments Rattling Markets Further
- Extreme Fear Is Here, Here Is What History Says Happens Next
- Frequently Asked Questions
June 2026 handed crypto investors one of the sharpest reality checks of the year, and the signals were hiding in plain sight well before Bitcoin cracked $60,000. This crypto market report for June 29, 2026 breaks down exactly what happened and why.
Risk sentiment deteriorated fast throughout the final week of June. A hotter-than-expected May PCE report landed first, cementing expectations that the Fed would keep rates restrictive longer than markets had hoped. That alone would have been enough to pressure risk assets. But crypto had its own set of problems piling on simultaneously, sustained ETF outflows, mounting stress in Strategy’s capital structure, and a notable rotation of speculative capital away from digital assets and toward AI-related equities. For investors trying to make sense of the week’s action, this crypto market analysis breaks down the key drivers and what they mean for positioning going forward.
The result was a week that looked deceptively simple on the surface, prices fell, but was structurally complex underneath, with derivatives, macro data, and institutional flows all interacting in ways that matter for understanding what happens next.
| Asset | Price (USD) | Weekly Change |
|---|---|---|
| Bitcoin (BTC) | ~$58,980 | -8% |
| Ethereum (ETH) | ~$1,560 | -4.33% (estimates vary by data source) |
| XRP | N/A | -11.90% |
| BNB | N/A | N/A |
| Total Market Cap | ~$2.16T | N/A |
| BTC Dominance | ~58% | N/A |
Bitcoin Fell Below $60,000 for the First Time Since October 2024 – Crypto Market Report June 29, 2026
Bitcoin extended its correction through the final week of June, breaking below the psychologically critical $60,000 level on Thursday, June 25, a threshold it hadn’t breached since late 2024. The move was sharp and decisive, cutting through what many traders had considered a strong technical floor.
BTC Dropped 8% in a Single Week, Now 50% Below Its October 2025 Peak
By the weekend, BTC had settled near $58,980, representing approximately an 8% loss for the week alone. To put that in broader context, Bitcoin is now trading more than 50% below its October 2025 peak of $126,080, a staggering drawdown that has erased months of bullish momentum and forced a reassessment of near-term price targets across the board. The speed of the decline was driven as much by macro conditions as by crypto-specific dynamics, which made it harder to dismiss as noise.
Ethereum Underperformed, Sliding to $1,560 as High-Beta Assets Got Hit Hard
Ethereum didn’t just fall alongside Bitcoin, it underperformed it. ETH dropped to approximately $1,560 during the week (weekly percentage change estimates vary by data source), a level that reflects how aggressively traders have been shedding higher-beta exposure. When risk appetite contracts quickly, Ethereum tends to absorb more of the selling pressure than Bitcoin, and June 2026 was a textbook example of that dynamic playing out in real time. XRP fared even worse, posting a weekly decline of nearly 12% as altcoins bore the brunt of the rotation out of speculative positions.
BTC Dominance Climbed Above 58%, Signaling Traders Are Avoiding Altcoins
Bitcoin dominance rising above 58% of total crypto market cap tells a clear story: when fear spreads, capital consolidates into the asset with the strongest liquidity and clearest institutional narrative. Altcoins, which require higher risk tolerance and deeper conviction, get sold first.
This pattern of dominance expansion during downturns is well-established. What makes June 2026 notable is that the flight to relative safety happened alongside, not after, the Bitcoin selloff. That simultaneity suggests investors weren’t just rotating within crypto; many were exiting the asset class entirely into cash or AI equities.
- BTC dominance crossed 58% as altcoins shed value faster than Bitcoin
- XRP dropped nearly 12% on the week, the worst performer among major assets
- ETH fell to $1,560, reinforcing its role as the most macro-sensitive large-cap crypto
- Total market cap held near $2.16T despite the drawdown, suggesting some capital remained deployed
- Speculative tokens and lower-cap altcoins saw the steepest losses as leverage unwound
What Triggered the June 2026 Crypto Selloff
No single event caused this. It was a convergence, macro data, institutional stress, and shifting capital flows hitting the market at the same time. For those considering diversification, exploring stablecoins backed by gold might offer a safer alternative during volatile times.
Hotter-Than-Expected May PCE Data Reinforced Higher-For-Longer Rate Expectations
The May PCE print was the match that lit the fuse. Coming in hotter than consensus estimates, it made a near-term Fed pivot essentially impossible to argue for and sent rate-sensitive assets, crypto included, into a defensive posture. Markets that had been pricing in some easing optimism were forced to recalibrate, and that repricing hit digital assets hard given their sensitivity to liquidity conditions.
Crypto increasingly trades in lockstep with the Nasdaq during macro shock events, and June 2026 was no different. Bitcoin moved alongside tech equities as macro-driven risk aversion dominated price action, leaving little room for crypto-specific bullish narratives to gain traction.
Record ETF Outflows Drained Liquidity From the Market
U.S. spot Bitcoin ETFs extended what had already become a multi-week outflow streak. Institutional de-risking was the dominant theme, and the data reflected it clearly, with some data suggesting corporate treasury activity may have turned net-selling for the first time in 2026, a notable potential reversal that would signal shifting sentiment at the institutional level. For more insights, check out this weekly crypto market wrap.
ETF outflows matter in a specific mechanical way: they require ETF issuers to sell underlying Bitcoin to meet redemptions, which places direct selling pressure on spot markets. When those outflows persist over multiple weeks without offsetting inflows, the cumulative effect compounds. That’s exactly what played out through June.
Key Data Point: U.S. Spot Bitcoin ETF outflows extended their multi-week streak through the week ending June 29, 2026, with some data suggesting corporate treasury activity may have turned net-selling for the first time this year, a potential shift worth watching in institutional positioning.
Strategy’s Variable Rate Preferred Stock (STRC) Added Institutional Uncertainty
Strategy, formerly MicroStrategy, became one of the market’s most closely watched risk factors during June. The company now holds approximately 847,000 BTC acquired at an average cost of around $75,650 per coin. With Bitcoin trading near $58,980, those holdings are deeply underwater on a mark-to-market basis, and that created a feedback loop that amplified selling pressure.
The mechanism works like this: stress in Strategy’s capital structure, specifically its Variable Rate Preferred Stock, STRC, which printed all-time lows near $72, encourages traders to hedge by shorting BTC. That shorting pushes Bitcoin’s price lower, which increases mark-to-market losses on Strategy’s treasury, which puts further pressure on STRC, which reinforces bearish sentiment. The cycle becomes self-reinforcing even without any actual Bitcoin sales from Strategy. Strategy briefly lost its Bitcoin premium entirely, with enterprise mNAV dipping below 1 for the first time. For those wondering is Bitcoin mining still worth it amid such market conditions, the answer might surprise you.
Speculative Capital Rotated Away From Crypto and Into AI Equities
The final piece of the puzzle was capital rotation. Risk appetite didn’t disappear entirely in June, it redirected. Speculative money that might previously have flowed into altcoins or leveraged crypto positions moved instead into AI-related equities, which offered a growth narrative without the macro headwinds weighing on digital assets. This rotation reduced the pool of available buyers in crypto markets precisely when sellers were most active.
June Liquidations By The Numbers
The most striking technical feature of the week ending June 29 was the sharp divergence between volatility and leverage. Bitcoin’s move below $60,000 triggered a significant repricing across options markets, while futures and credit conditions remained comparatively orderly, an unusual split that carried important signals for how the market was absorbing the selling pressure. Zerocap’s derivatives desk estimated approximately $1.48 billion in liquidations occurred over a 24-hour period, with more than $1.2 billion coming from long positions alone.
Liquidations concentrated heavily on the long side as BTC broke through the $60,000 level, flushing out leveraged positions that had been built during the earlier consolidation phase. The cascade wasn’t as catastrophic as some prior liquidation events in crypto history, but it was sustained and systematic rather than a single violent flush, which can actually be more damaging for sentiment because it removes the possibility of a quick v-shaped recovery narrative.
How Hard Derivatives Markets Got Hit
Futures markets bore the brunt of the initial repricing. As Bitcoin moved below $60,000 on June 25, open interest contracted sharply as long positions were liquidated or voluntarily closed. The move below the psychological level triggered stop-loss cascades that amplified the downside, a pattern familiar to anyone who has traded crypto through previous macro-driven corrections.
What was notably different in June 2026 compared to prior corrections was that credit conditions in the crypto derivatives market stayed relatively contained. There were no major exchange insolvencies or counterparty failures reported, the stress remained concentrated in price action rather than spreading into structural market integrity issues.
Perpetual Funding Rates Briefly Turned Negative Before Recovering
Perpetual funding rates, one of the most reliable real-time indicators of market sentiment in crypto, briefly flipped negative during the week’s sharpest selling, signaling that short sellers were briefly dominant and willing to pay a premium to maintain bearish positions. This is a meaningful development because negative funding in perpetuals reflects genuine conviction on the downside, not just passive de-risking.
The recovery in funding rates toward neutral by the end of the week suggested that the most aggressive short positioning had begun to unwind, either through profit-taking or through longs re-entering at perceived value levels near the $58,000 support zone. Whether that recovery was the beginning of stabilization or simply a temporary pause before another leg lower remained the central question heading into July.
Options Markets Repriced Sharply to Reflect Downside Risk
The options market told the most complete story of June’s selloff. While spot prices grabbed the headlines, the real structural shift happened in derivatives, specifically in how quickly implied volatility expanded and how decisively put demand accelerated once Bitcoin broke below $60,000.
What made this repricing notable wasn’t just its speed. It was the fact that it happened while futures basis and funding rates stayed relatively contained, creating an unusual split between options-market fear and broader leverage conditions. That divergence suggested the market was pricing in tail risk rather than signaling imminent structural collapse, an important distinction for anyone trying to assess whether the bottom is in or further downside remains.
Front-End BTC Implied Volatility Surged From Low-40% to High-40% Range
Before the June selloff, front-end BTC implied volatility had been sitting comfortably in the low-40% range, historically elevated but not alarming. The break below $60,000 changed that quickly, pushing front-end implied volatility into the high-40% range within a matter of days as market makers scrambled to reprice near-term risk.
- Front-end BTC IV moved from low-40% to high-40% range following the $60K break
- 1-month implied volatility lifted to approximately 45%
- Term structure steepened as near-term uncertainty outpaced longer-dated vol
- Options market activity concentrated on short-dated contracts as traders sought immediate downside protection
- Market makers widened spreads on BTC options to account for the increased directional risk
The speed of the implied volatility expansion reflected genuine uncertainty rather than mechanical hedging flows. When IV moves this fast on the front end, it typically means options market participants are actively reassessing their probability distributions for near-term price outcomes, not just adjusting position sizes.
For traders watching volatility surfaces, the steepening of the term structure was a signal that the market viewed near-term risk as disproportionately elevated relative to longer time horizons. That’s actually a somewhat constructive longer-term signal, it implies the market doesn’t believe this level of stress will persist indefinitely, even if the near-term picture remains uncomfortable. For more insights, check out the Weekly Crypto Market Wrap.
1-Month Implied Volatility Lifted to Around 45%
The 1-month implied volatility reading of approximately 45% placed BTC squarely in territory that options traders associate with significant directional uncertainty. At 45% annualized, the options market was pricing in daily moves of roughly 2.8% in either direction, a level that makes both hedging costs and premium collection strategies meaningfully more expensive and more rewarding respectively, depending on which side of the trade you’re on.
Put Demand Accelerated as 1-Week 25-Delta Skew Widened to 4-5%
Perhaps the clearest expression of fear in the options market was the acceleration in put demand. The 1-week 25-delta skew, a standard measure of how much more expensive downside puts are relative to equivalent upside calls, widened to between 4% and 5% during the week. That’s a meaningful shift from the neutral-to-slightly-positive skew that had prevailed earlier in the month, and it reflects genuine demand for downside protection rather than speculative short positioning.
When skew widens to this degree on the short end, it typically signals that market participants are actively paying up for insurance. That’s different from a situation where puts are cheap and shorts are dominant, it means real money was flowing into hedges, which implies underlying long exposure that holders weren’t willing to liquidate outright but wanted to protect. The 1-week 25-delta skew widened to 4-5%, reflecting elevated put demand.
- Protective put buying was concentrated in short-dated strikes below $57,000 and $55,000
- Call sellers used the elevated IV to generate premium income against existing long positions
- Skew expansion was faster and more pronounced than during previous June 2026 volatility episodes
The combination of elevated IV and widening skew creates a challenging environment for directional options traders but provides useful information for everyone else: the market was pricing in more downside than upside in the very near term, and that asymmetry was worth taking seriously regardless of your longer-term conviction on Bitcoin.
Carry Markets Stayed Relatively Calm Despite the Chaos
While options markets were repricing aggressively, carry markets, the basis and funding rate environment that professional traders use to harvest yield from crypto, stayed surprisingly composed. This divergence between vol-market fear and carry-market stability was one of the most technically interesting features of the June 2026 selloff, and it carried meaningful implications for how to interpret the overall market structure.
BTC 3-Month Annualised Basis Held Near 3.5%, Up From 2% a Month Ago
The BTC 3-month annualized basis, the premium that quarterly futures trade at relative to spot, held near 3.5% through the week’s selling, which actually represented an increase from the approximately 2% level recorded a month prior. A rising basis during a price correction is counterintuitive on the surface, but it reflects the fact that institutional carry traders were maintaining their positions and, in some cases, adding to them at lower prices, a sign that professional money saw the correction as a buying opportunity in the basis trade rather than a reason to exit entirely.
ETH Basis Stayed Near 1.5%, Reinforcing the Gap Between BTC and Broader Crypto Risk
Ethereum’s 3-month basis remained near 1.5%, meaningfully lower than Bitcoin’s 3.5%, and that gap told its own story. The tighter ETH basis reflects lower institutional demand for Ethereum carry exposure relative to Bitcoin, which aligns with the broader narrative of capital consolidating into BTC during periods of stress. Carry traders who want crypto yield exposure without taking on the additional risk premium associated with altcoins chose Bitcoin overwhelmingly, and the basis spread between the two assets quantified that preference precisely. For those considering broader crypto investments, exploring how beginners can invest in cryptocurrency with low risk can provide valuable insights.
3 Key Levels and Events That Will Define BTC’s Next Move
With Bitcoin closing the week near $58,980, the market is at a genuinely consequential juncture. The next several days will likely determine whether June 2026 goes down as a sharp but ultimately contained correction, or the beginning of a more extended bear phase.
Three specific developments stand out as the variables that matter most for price direction heading into early July. Each one operates through a different mechanism, and together they create a framework for monitoring what to watch without getting lost in noise.
1. Whether BTC Can Hold Its 200-Week Moving Average and the $58,000 Support Zone
The 200-week moving average is one of the most closely watched long-term technical indicators in Bitcoin’s history. It has acted as a reliable support floor during prior bear markets, and its proximity to the current $58,000 support zone makes this price level doubly significant. A clean hold above both the 200-week MA and the $58,000 level would give bulls a credible technical narrative to rally around. A decisive break below would likely accelerate selling as algorithmic traders and stop-loss orders kick in simultaneously.
2. Whether Strategy’s STRC Stabilises or Its Discount Widens Further
Strategy’s STRC preferred stock has become a real-time proxy for institutional stress in the Bitcoin market. When STRC trades at a deep discount, as it did when it printed all-time lows near $72, it signals that sophisticated investors are pricing in meaningful risk around Strategy’s capital structure. That perception, whether ultimately accurate or not, creates its own market reality through the shorting feedback loop described earlier.
A stabilization in STRC pricing would remove one of the most persistent sources of negative sentiment overhanging the market. It would signal that institutional holders of Strategy’s preferred equity have found a price level they’re comfortable with, which would reduce the incentive for traders to use BTC shorts as a hedge against STRC exposure.
The math here is stark: Strategy holds approximately 847,000 BTC at an average cost of ~$75,650. With BTC near $58,980, the company is sitting on significant unrealized losses. The longer Bitcoin remains below Strategy’s average acquisition cost, the more pressure builds on coverage metrics and investor confidence, even if actual forced selling remains unlikely given the company’s liability structure.
3. Thursday’s US Payrolls Report as the Next Major Macro Catalyst
The US nonfarm payrolls report due Thursday is the most significant macro event on the immediate horizon. A weaker-than-expected jobs number would introduce the possibility of Fed dovishness back into the conversation, potentially providing the macro relief valve that crypto markets desperately need. Rate-sensitive assets including Bitcoin have been punished by the higher-for-longer narrative that the May PCE report reinforced, a soft payrolls print could begin to unwind some of that pressure.
Conversely, a strong payrolls number would cement the hawkish case further, likely triggering another risk-off wave across equities and crypto simultaneously. The ECB Forum comments running concurrently add another layer of potential macro volatility, as any signals about European rate policy could amplify or dampen the US payrolls reaction across global risk assets.
What Could Actually Turn This Market Around
Extreme fear readings on the Crypto Fear and Greed Index are notoriously difficult to trade in real time, but historically they have marked the zone where medium-term recoveries begin, not necessarily because selling is finished, but because the pool of motivated sellers starts to exhaust itself. There are three credible catalysts that could shift June’s narrative from continued decline to stabilization and eventual recovery.
Washed-Out Positioning Means There Is Less Forced Selling Left in the System
After weeks of ETF outflows, leveraged long liquidations, and corporate treasury de-risking, the marginal seller in the market is increasingly a discretionary holder rather than a forced one. Forced selling, from margin calls, ETF redemptions, and stop-loss triggers, creates indiscriminate price action that bears little relationship to fundamental value. As those forced sellers exhaust their positions, the remaining selling pressure requires active conviction to execute, which is a meaningfully higher bar. The liquidation of leveraged longs through June has likely cleared much of the most vulnerable positioning from the system, reducing the risk of another cascade triggered by mechanical stops.
“Consensus positions in markets are inherently fragile, they require continued confirmation to persist, and any deviation from the bearish narrative can trigger rapid reversals.”
Falling Oil Prices Could Ease Inflation Expectations Ahead of July CPI Data
One underappreciated potential catalyst for a crypto recovery is the recent softness in oil prices. Falling energy costs feed directly into headline inflation readings, and if that softness persists through June’s data collection window, the July CPI print could come in below consensus expectations. That outcome would materially weaken the higher-for-longer narrative that has been the single most consistent headwind for risk assets, including Bitcoin, throughout the second quarter of 2026. A softer CPI number doesn’t guarantee Fed dovishness, but it reopens the debate in a way that a hot print forecloses entirely.
Long-Term Holders and Patient Buyers Are Beginning to Absorb Supply
On-chain data tells a story that the price action obscures. Long-term holders, wallets that have held Bitcoin for more than 155 days without moving coins, have been quietly accumulating during the June selloff, absorbing supply that short-term traders and ETF redemptions have been generating. This is the same pattern that preceded recoveries in prior Bitcoin corrections, including the mid-2024 drawdown and the 2022 bear market lows.
The significance here is structural. Long-term holders don’t panic-sell at $58,000, they’ve already demonstrated the conviction to hold through multiple volatile cycles. When they start buying actively rather than just holding, it tightens the available float of Bitcoin on exchanges and gradually shifts the supply-demand balance in favor of bulls. It doesn’t produce an instant price reversal, but it builds the foundation that a recovery eventually stands on. Combined with washed-out leverage and possible macro relief from payrolls data, this accumulation is one of the more credible reasons to expect stabilization rather than continued freefall. For those interested in understanding more about the dynamics of crypto markets, you can read the Crypto Market Report June 22, 2026.
Regulatory Developments Rattling Markets Further
As if macro headwinds and institutional stress weren’t enough, regulatory pressure intensified across two major jurisdictions during June. Neither development was entirely unexpected, but the timing amplified the negative sentiment already weighing on markets, and both carry material implications for how crypto businesses operate going forward.
ED Launches Cross-Border Crypto Transfer Probe Involving Over ₹2,500 Crore
India’s Enforcement Directorate opened an investigation into cross-border cryptocurrency transfers, with the probe involving over ₹2,500 crore in flagged transactions. The investigation targets allegedly unauthorized transfers that bypassed India’s foreign exchange management framework. For the broader market, this matters beyond India’s borders, regulatory enforcement actions in major emerging markets create compliance uncertainty that institutional participants take seriously, particularly as global crypto adoption increasingly depends on emerging market growth to sustain the next leg of user expansion. Any signal that large jurisdictions are tightening enforcement around cross-border flows adds friction to capital movement and chills both retail and institutional participation.
EU Regulators Ramp Up MiCA Enforcement, Threatening Unlicensed Firms With Shutdown
In Europe, regulators accelerated MiCA enforcement timelines, with unlicensed crypto firms now facing explicit shutdown threats as transitional periods approach their end. The Markets in Crypto-Assets regulation represented one of the most comprehensive crypto regulatory frameworks globally when it passed, and the transition from policy to active enforcement is creating real operational pressure on firms that haven’t completed their licensing processes. Traders monitoring next week should note that the end of MiCA’s transitional periods was specifically flagged as a key event to watch, any forced withdrawal of unlicensed service providers from European markets would reduce liquidity and trading infrastructure availability for European retail participants, compounding the macro-driven selling pressure already in play.
Extreme Fear Is Here, Here Is What History Says Happens Next
The Crypto Fear and Greed Index registered Extreme Fear through the final week of June 2026, and while that reading feels terrible in the moment, history has consistently shown that extreme fear zones are where the best medium-term entry opportunities for patient buyers tend to concentrate. That’s not a prediction. It’s a statistical observation from every major crypto market cycle on record.
The mechanism isn’t mysterious. Extreme fear readings emerge when selling has been sustained, leverage has been cleared, and negative sentiment has become the consensus position. Consensus positions in markets are inherently fragile, they require continued confirmation to persist, and any deviation from the bearish narrative can trigger rapid reversals as short sellers cover and sidelined buyers re-enter simultaneously. The move from extreme fear to recovery is rarely smooth or linear, but the directional tendency over 3-to-6-month horizons following extreme fear readings has historically favored buyers who could tolerate the near-term volatility.
What makes June 2026’s fear reading particularly interesting is the context surrounding it. Bitcoin is testing its 200-week moving average, a level that has historically defined the floor of bear markets. Long-term holders are accumulating. Leverage has been substantially cleared from the system. The macro catalyst that broke sentiment (hot PCE data) is potentially reversible if payrolls data softens. None of these factors guarantee a recovery, but they collectively represent a setup that looks more like a tradeable bottom than the beginning of an uncontrolled collapse.
- Extreme Fear has preceded major recoveries in every major Bitcoin market cycle, including Q4 2022, mid-2024, and the March 2020 COVID crash
- The 200-week moving average has historically defined bear market floors, Bitcoin is testing it right now near $58,000
- Long-term holder accumulation during price weakness signals the smart-money positioning that typically precedes recoveries
- Cleared leverage removes the risk of mechanical cascade selling, making a floor more structurally durable
- Macro relief is possible, a softer payrolls print or CPI reading could quickly reverse the higher-for-longer narrative driving the selloff
- Altcoins like Solana and Aave already posted gains during the week despite the broader selloff, an early sign that selective buying is returning in pockets of the market
Frequently Asked Questions
Here are answers to the most common questions investors are asking about this crypto market report for June 29, 2026 and what the selloff means for positioning going forward.
Why Did Bitcoin Fall Below $60,000 in June 2026?
Bitcoin fell below $60,000 in June 2026 due to a convergence of macro and crypto-specific pressures. A hotter-than-expected May PCE inflation report reinforced expectations that the Federal Reserve would keep interest rates higher for longer, triggering risk-off selling across liquidity-sensitive assets. Simultaneously, U.S. spot Bitcoin ETFs extended a multi-week outflow streak, some data suggested corporate treasury activity may have turned net-selling for the first time in 2026, and stress in Strategy’s STRC preferred stock created a feedback loop that amplified downward price pressure. Capital rotation away from crypto and into AI-related equities removed buyers from the market at precisely the moment selling pressure was peaking.
What Does Extreme Fear Mean in the Crypto Fear and Greed Index?
Extreme Fear on the Crypto Fear and Greed Index means market sentiment has deteriorated to the point where the majority of participants are selling or avoiding buying out of fear of further losses. The index measures factors including volatility, market momentum, social media sentiment, and trading volume, synthesizing them into a single score from 0 (maximum fear) to 100 (maximum greed). Historically, readings in the Extreme Fear zone have corresponded with periods of maximum pessimism, which, counterintuitively, have often marked medium-term price bottoms rather than the beginning of sustained declines.
How Do ETF Outflows Affect Bitcoin’s Price?
ETF outflows affect Bitcoin’s price through a direct mechanical channel. When investors redeem shares in a spot Bitcoin ETF, the fund is required to sell the underlying Bitcoin it holds to return cash to the redeeming investor. That selling hits the spot market directly, creating real downward price pressure that scales with the volume of redemptions. When outflows persist over multiple consecutive weeks, as they did through June 2026, the cumulative selling pressure compounds, and the absence of offsetting inflows means there’s no natural buyer on the other side of those trades at prevailing prices. The multi-week ETF outflow streak in June was one of the most consistent sources of supply pressure in the market during the selloff.
What Is Strategy’s STRC and Why Does It Matter for Crypto Markets?
Strategy (MSTR) Key Figures, June 2026
| BTC Holdings | ~847,000 BTC |
| Average Acquisition Cost | ~$75,650 per BTC |
| BTC Price at Week Close | ~$58,980 |
| Unrealized Loss Per Coin | ~$16,670 |
| STRC All-Time Low | ~$72 |
| Enterprise mNAV | Briefly dipped below 1.0 |
STRC is Strategy’s Variable Rate Preferred Stock, a financial instrument the company issued as part of its Bitcoin treasury financing strategy. Unlike common equity, preferred stock carries specific dividend and repayment obligations that create defined financial pressure points when the underlying assets (in this case, Bitcoin) decline in value. When Bitcoin trades well below Strategy’s average acquisition cost of approximately $75,650, the coverage metrics that determine STRC’s financial safety begin to deteriorate, causing the preferred stock to trade at a discount to its theoretical value. Learn more about whether Bitcoin mining is still worth it in 2026.
The reason STRC matters for the broader crypto market is the feedback loop it creates. As STRC falls in value, traders who hold or are exposed to Strategy’s capital structure use Bitcoin short positions as a hedge, effectively betting against BTC to offset their STRC risk. That shorting pressure pushes Bitcoin’s spot price lower, which increases Strategy’s mark-to-market losses, which puts further pressure on STRC, which encourages more hedging. The loop runs without requiring Strategy to actually sell any Bitcoin, which means the price impact is real even if the underlying forced selling hasn’t materialized. STRC printing all-time lows near $72 and enterprise mNAV briefly dipping below 1 during June 2026 were the specific data points that made this feedback loop most visible to markets.
It’s worth noting that actual forced selling from Strategy remains unlikely given the company’s liability structure and the substantial equity buffer that still exists before creditor concerns become existential. The risk is primarily one of sentiment and market perception rather than near-term solvency, but perception drives prices in the short term, and the STRC dynamic was a genuine source of sustained negative sentiment throughout June 2026.
Is Now a Good Time to Buy Bitcoin During Extreme Fear?
Extreme Fear readings have historically corresponded with favorable medium-term entry points for patient buyers, but “historically favorable” is not the same as “guaranteed.” Bitcoin is currently testing its 200-week moving average near $58,000, a level that has defined bear market floors in prior cycles. Long-term holders are accumulating. Leverage has been substantially cleared from derivatives markets. Those are constructive structural conditions for a patient buyer with a 6-to-12-month time horizon. For those new to the market, understanding how beginners can invest in cryptocurrency with low risk is crucial.
The risks are real and shouldn’t be dismissed. The May PCE report confirmed that inflation remains sticky, and if payrolls data also comes in hot, the higher-for-longer narrative will intensify further. Strategy’s STRC situation could deteriorate in ways that create additional selling pressure even without forced BTC liquidations. And regulatory actions in India and Europe add operational friction that reduces market participation. Any of these factors could push Bitcoin through the $58,000 support level, potentially targeting lower support zones.
The honest answer is that nobody knows whether $58,980 represents the bottom of this correction. What history and current market structure both suggest is that the risk-reward for medium-term buyers improves significantly at Extreme Fear readings near key long-term technical support, and that the conditions in place at the end of June 2026 are more consistent with a recoverable correction than a structural collapse. Position sizing, risk management, and time horizon matter enormously here. Entering with a position you can hold through further short-term volatility is the only approach that gives this setup a genuine chance to play out in your favor.
For ongoing analysis of market conditions like these, explore the full suite of crypto market research and tools built to help investors navigate exactly the kind of volatility this crypto market report for June 29, 2026 documented.
DYOR Disclaimer
This article is for informational purposes only and does not constitute financial, investment, or tax advice. Cryptocurrency markets are highly volatile and past performance does not indicate future results. Always do your own research (DYOR) and consult a qualified financial professional before making any investment decisions.