
James Carter
Cryptocurrency Chart Analysis: What You Need To Know Right Now
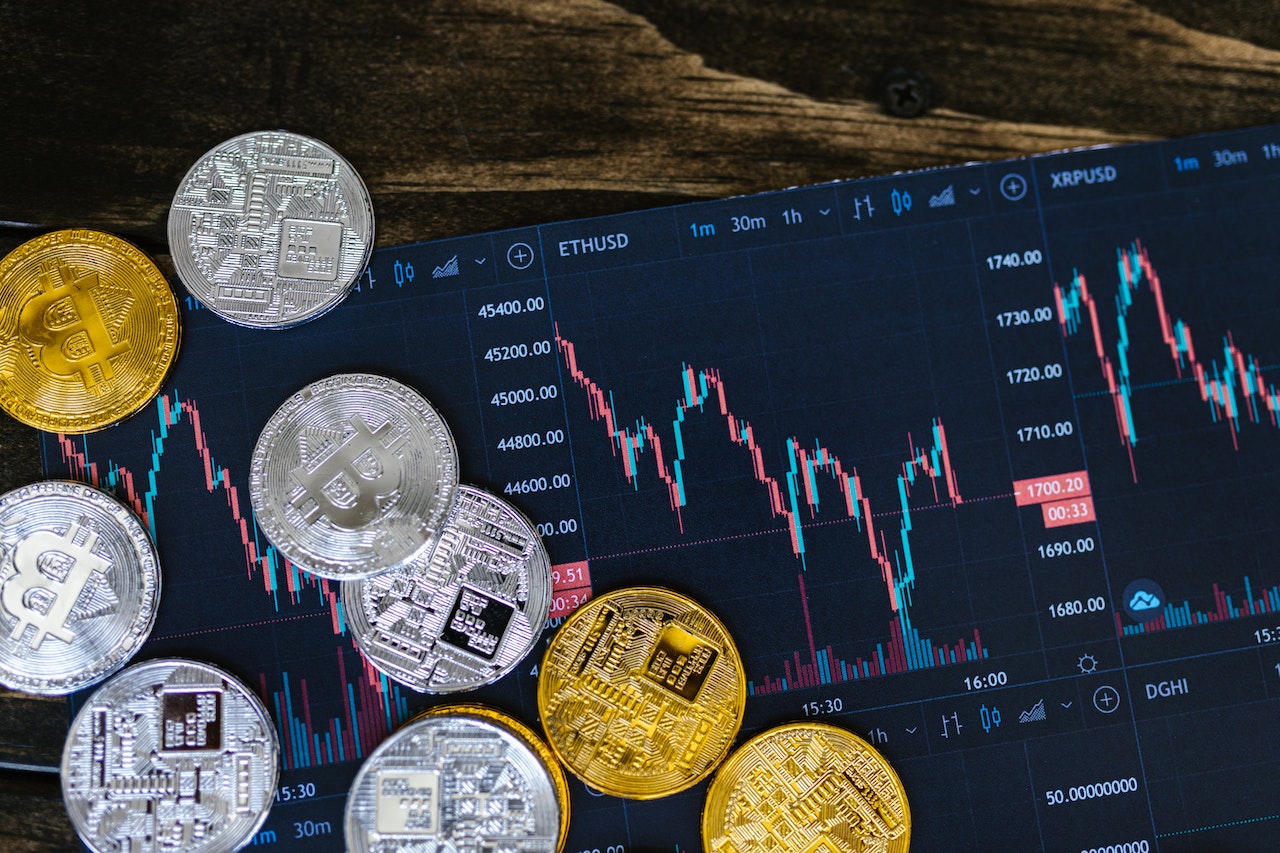
Cryptocurrency chart analysis is a method of evaluating a particular cryptocurrency’s price trends and patterns by studying its historical price data. Most of the time, this information is shown in a price chart. This chart can find critical levels of support and resistance, changes in trends, and other technical indicators that may help predict how prices will move.
There are many different techniques that can be used in cryptocurrency chart analysis, including trend analysis, momentum analysis, and volume analysis. Depending on the analyst’s goals and the features of the cryptocurrency being analyzed, these methods can be used alone or in combination. (Also Read: A Beginner’s Guide To Cryptocurrency Analysis Tool)
In addition to studying price data, cryptocurrency chart analysts may also consider other factors that may impact the price of a particular cryptocurrency, such as news events, regulatory developments, and market sentiment. By viewing all these things, analysts can learn more about the market and make better decisions about whether to buy, sell, or hold a particular cryptocurrency.
How to Use Cryptocurrency Chart Analysis
When you use cryptocurrency chart analysis to look at the price trends and patterns of a particular cryptocurrency, there are a few steps you can take:
1. Choose a charting platform: Several online platforms provide historical price data for cryptocurrencies, including CoinMarketCap, TradingView, and CoinGecko. Choose a platform that provides the data type and needed features, such as different time frames, technical indicators, and comparison tools.
2. Select a time frame: cryptocurrency price charts can be displayed in various time frames, ranging from a few minutes to several years. Choose a time frame that is appropriate for your analysis. For example, if you are looking for short-term price movements, you might choose a time frame of several hours or days. If you are looking for long-term trends, you might choose a time frame of several months or years.
3. Identify key levels: Look for areas on the chart where the price has historically found support or resistance. These levels may indicate critical points where the price is likely to change direction.
4. Look for patterns: Many chart patterns, such as head and shoulders, triangles, and wedges, can provide clues about the market’s direction. Look for these patterns and consider how they might impact the price in the future.
5. Use technical indicators: Technical indicators are mathematical calculations based on a cryptocurrency’s price and/or volume. Many technical indicators can be used in cryptocurrency chart analysis, such as moving averages, the relative strength index (RSI), and moving average convergence and divergence (MACD). These indicators can help you identify trends, momentum, and potential reversal points.
6. Consider other factors: In addition to studying the price data, consider other factors that may impact the price of a particular cryptocurrency, such as news events, regulatory developments, and market sentiment. These factors can provide additional context and help you make more informed decisions.
It is important to note that cryptocurrency chart analysis is just one tool that can be used to evaluate the market. It is not a perfect science, and there are no guarantees about the market’s future direction. It is always essential to do your own research and use your judgment when making investment decisions.
What to Look For in a Cryptocurrency Chart Analysis?
When analyzing a cryptocurrency chart, there are several things that you may want to look for:
1. Trend: The trend of a cryptocurrency is the general direction in which its price is moving. A trend can be upward, downward, or sideways. Identifying the trend can help determine whether the market is bullish (trending upward) or bearish (trending downward). It can help you make more informed decisions about buying, selling, or holding a particular cryptocurrency.
2. Support and resistance: Support is a level at which the price of a cryptocurrency tends to find support as it falls. Resistance is a level at which the price tends to encounter resistance as it rises. Finding critical levels of support and resistance can help determine where the price will likely change direction. This can help you set stop-loss orders and take-profit orders.
3. Chart patterns: Many patterns can provide clues about the market’s direction. Some common chart patterns include head and shoulders, triangles, and wedges.
4. Technical indicators: Technical indicators are mathematical calculations based on the price and volume of a cryptocurrency. Many technical indicators can be used in cryptocurrency chart analysis, such as the moving average, the relative strength index (RSI), and moving average convergence and divergence (MACD). These indicators can help you identify trends, momentum, and potential reversal points.
5. Volume: The volume of a cryptocurrency is the number of units traded over a given period. Higher volume can show that more people are interested in a particular cryptocurrency, while lower volume can show that fewer people are interested.
6. Other factors: In addition to studying the price data, consider other factors that may impact the price of a particular cryptocurrency, such as news events, regulatory developments, and market sentiment. These factors can provide additional context and help you make more informed decisions.
It is important to note that cryptocurrency chart analysis is just one tool that can be used to evaluate the market. It is not a perfect science, and there are no guarantees about the market’s future direction. It is always important to do your own research and use your judgment when making investment decisions.
The Benefit of Cryptocurrency Chart Analysis
There are several benefits to using cryptocurrency chart analysis:
1. Identifying trends: Cryptocurrency chart analysis can help you identify the overall direction in which the price of a particular cryptocurrency is moving. This can be useful in determining whether the market is bullish (trending upward) or bearish (trending downward) and can help you make more informed buy, sell, or hold decisions.
2. Identifying key levels: By studying historical price data, you can identify key levels of support and resistance and areas where the price has historically found support or encountered resistance. These levels can be useful in setting stop-loss orders and take-profit orders.
3. Identifying potential reversal points: By analyzing momentum and technical indicators, you can identify possible reversal points where the market’s direction may change. This can be useful in managing risk and maximizing returns.
4. Making better decisions: By taking into account a wide range of factors, such as price data, technical indicators, news events, changes in regulations, and market sentiment, you can learn more about the market and make better decisions about whether to buy, sell, or hold a particular cryptocurrency.
6. Improving risk management: You can better manage risk and reduce losses by figuring out key levels and possible turning points.
Disadvantages of Cryptocurrency Chart Analysis
There are a few potential disadvantages to using cryptocurrency chart analysis:
1. Limited data: Cryptocurrencies are relatively new, and the historical price data for many of them is limited. This can make it hard to spot long-term trends or accurately predict how prices will change.
2. Market volatility: Cryptocurrencies can be highly volatile, with prices swinging dramatically quickly. This can make it hard to analyze the market correctly and implement trading strategies.
3. Lack of fundamental data: Unlike traditional markets, there is often a lack of essential data available for cryptocurrencies, such as earnings reports or balance sheets. This can make it challenging to analyze the underlying value of a particular cryptocurrency.
4. Emotional bias: It can be easy to let emotions cloud your judgment when analyzing the market. When analyzing cryptocurrency charts, it’s essential to keep an open mind and work systematically.
5. No guarantees: cryptocurrency chart analysis is not a perfect science, and there are no guarantees about the market’s future direction. It is always important to do your own research and use your judgment when making investment decisions. (Also Read: Cryptocurrency ATMs: The New Way To Buy Bitcoin )


Latest
Blockchain
09 May 2024
Blockchain
19 Apr 2024
Blockchain
16 Jan 2024
Blockchain
31 Aug 2023
Blockchain
24 Jun 2023
Blockchain
24 Jun 2023
Recent News

Bitcoin
24 Jun 2023

Blockchain
24 Jun 2023

Blockchain
24 Jun 2023

Altcoins
24 Jun 2023

Bitcoin
24 Jun 2023

Altcoins
24 Jun 2023

Bitcoin
23 Jun 2023

News
23 Jun 2023