James Carter
What is cryptocurrency chart analysis

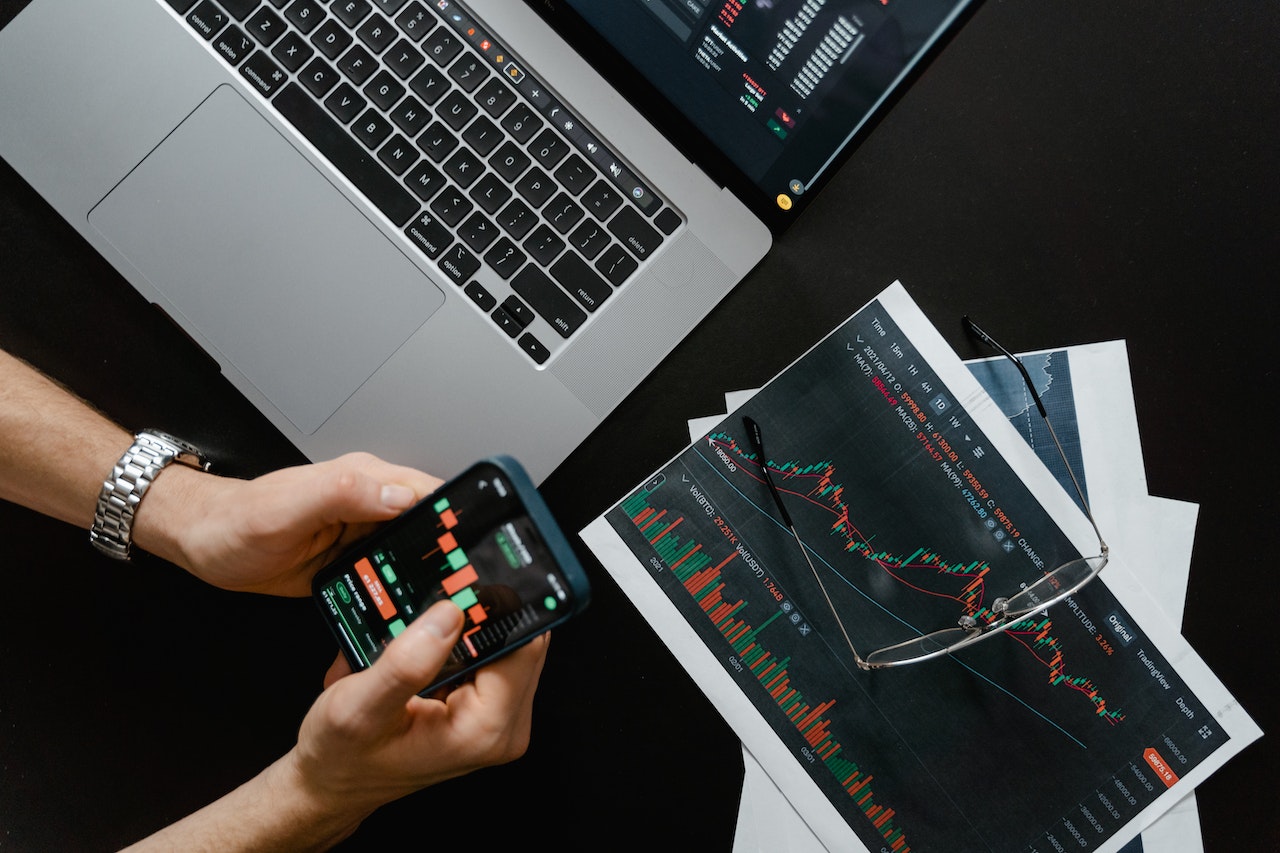
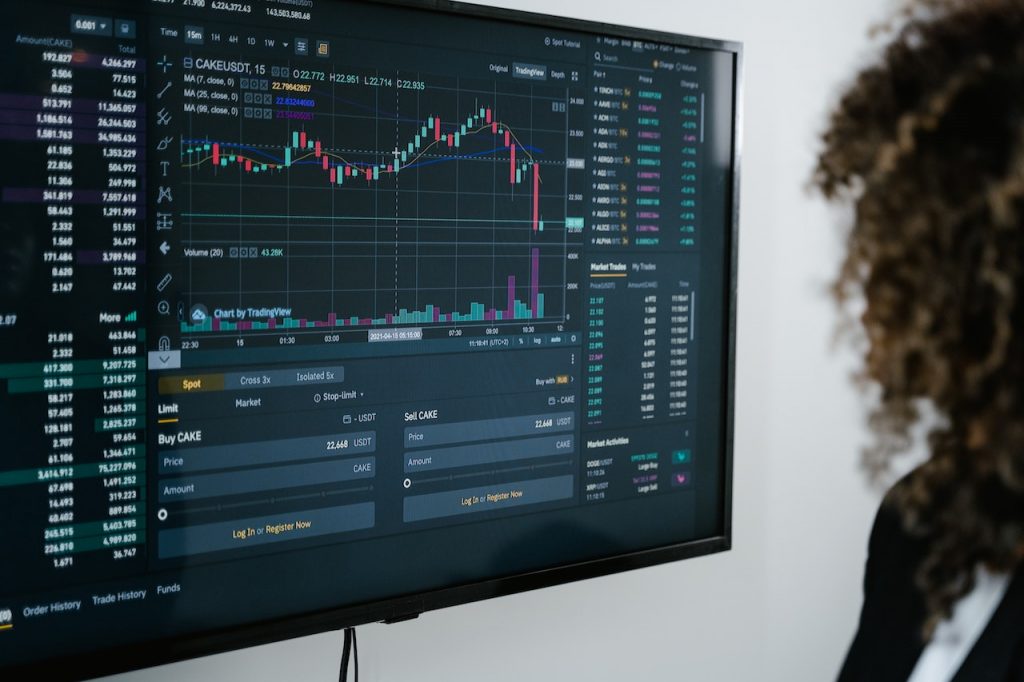
Cryptocurrency chart analysis is the process of looking at the price and other information about cryptocurrencies so that traders can make smart decisions. This involves looking at historical data, such as price and volume trends, and using technical analysis techniques to identify patterns and trends that may suggest where the price is headed in the future. (Also Read: A Beginner’s Guide To Cryptocurrency Analysis Tool)
There are several tools and techniques that traders and analysts use in cryptocurrency chart analysis. These include:
1. Candlestick charts: These charts show the opening, closing, high, and low prices for a particular time period and are commonly used to identify patterns and trends in the market.
2. Moving averages: These are mathematical calculations that smooth out price data over a set period of time and can help identify trends and support and resistance levels.
3. Trend lines: These are lines drawn on a chart to connect highs or lows and show the direction of the trend.
4. Oscillators: are technical indicators that move back and forth between two values. They are used to tell when the market is overbought or oversold.
Example of cryptocurrency chart analysis
Here is an example of how you might use cryptocurrency chart analysis to make a trading decision:
Let’s say you are considering buying Bitcoin, and you want to use chart analysis to help you decide when to enter the market.
1. Choose a charting platform and select Bitcoin as the cryptocurrency you want to analyze. Choose a daily chart to get a broad view of the market.
2. Look for patterns and trends in the price data. You notice that the price has been in an uptrend over the past several months, with higher highs and higher lows. This is a bullish pattern and suggests that the trend is likely to continue.
3. Use technical indicators to confirm the trend. You add a 50-day moving average to the chart and notice that the price is consistently above the moving average, which is another bullish sign.
4. Consider other factors that may impact the price. You do some research and find out that there are several positive news events and developments related to Bitcoin, such as increasing adoption by major companies and a potential new regulation that could boost the market.
Based on this analysis, you decide that now is a good time to buy Bitcoin. You enter the market after setting a stop-loss and take-profit level based on the chart patterns and technical indicators you have found.
This is just one example of how you might use chart analysis to make a trading decision. It’s important to remember that cryptocurrency markets are very volatile and that past performance isn’t always a good indicator of what will happen in the future. It is a good idea to do your own research and use multiple sources of information when making trading decisions.

How to use cryptocurrency chart analysis for trading?
Here are some steps to perform chart analysis for cryptocurrencies.:
1. Choose a charting platform: There are many platforms available that offer charting tools and data for cryptocurrencies. Some popular options include TradingView, Coinigy, and CoinMarketCap. Choose a platform that offers the tools and data you need and is easy to use.
2. Select a cryptocurrency and time frame: Decide which cryptocurrency you want to analyze and choose the time frame you want to look at. Some common time frames for chart analysis include 1-hour, 4-hour, daily, and weekly charts.
3. Look for patterns and trends: Use tools like candlestick charts and trend lines to identify patterns and trends in the price data. Look for patterns that keep happening, like a head and shoulders or a double top, as these can be signs of possible turning points.
4. Use technical indicators: Technical indicators, such as moving averages and oscillators, can help you identify trend strength, overbought or oversold conditions, and potential reversal points. Choose the indicators that work best with your trading strategy and use them with chart patterns to make smart trading decisions.
5. Consider other factors: In addition to analyzing the price data, it is important to consider other factors that may impact the price of the cryptocurrency. These can include news events, changes in regulations, and adoption rates.
Remember, cryptocurrency chart analysis is just one aspect of trading, and it is important to use multiple sources of information and do your own research when making trading decisions. It is also important to understand the risks and limitations of this type of analysis.
The benefits of cryptocurrency chart analysis
There are several benefits to using cryptocurrency chart analysis for trading:
1. It can help you identify trends and patterns: chart analysis can help you identify trends and patterns in the price data, which can give you a better understanding of the market and help you make informed trading decisions.
2. It can help you set stop-loss and take-profit levels. By using chart patterns and technical indicators, you can set stop-loss and take-profit levels that are based on solid analysis rather than gut feelings. This can help you manage risk and maximize profits.
3. It can help you diversify your portfolio. Using chart analysis to identify trends and patterns in multiple cryptocurrencies, you can diversify your portfolio and potentially increase your chances of success.
4. It can help you make more informed trading decisions. Chart analysis can provide you with a complete picture of the market, which can help you make more informed trading decisions.
However, it is important to remember that chart analysis is just one aspect of trading, and it is vital to use multiple sources of information and do your own research when making trading decisions. It is also important to understand the risks and limitations of this type of analysis.
The disadvantages of cryptocurrency chart analysis
There are several disadvantages to using cryptocurrency chart analysis for trading:
1. It can be time-consuming. Analyzing charts and using technical indicators can be a complex and time-consuming process, especially for traders who are new to chart analysis.
2. It can be subjective: Different traders may interpret the same chart in different ways, and there is no one “correct” way to analyze a chart. This subjectivity can lead to different trading decisions based on the same data.
3. It is not a guarantee of success: Even if you use the best chart analysis techniques, there is no guarantee that you must be successful in your trades. Cryptocurrency markets are highly volatile, and past performance isn’t always a good indicator of what will happen in the future.
4. It can lead to overconfidence: If you have had success using chart analysis in the past, it can be tempting to rely on it too heavily and become overconfident in your trading decisions. It is important to remember that chart analysis is just one aspect of trading and to use multiple sources of information and do your own research when making trading decisions.
5. It is not a substitute for fundamental analysis. While chart analysis can be a valuable tool for traders, it is not a substitute for fundamental analysis, which looks at the underlying factors that drive the market. It is important to consider both technical and fundamental analysis when making trading decisions.
Conclusion
Cryptocurrency chart analysis is the process of analyzing the price and other data related to cryptocurrencies in order to make informed trading decisions. This involves looking at historical data, such as price and volume trends.
There are several tools and techniques that traders and analysts use in cryptocurrency chart analysis, including candlestick charts, moving averages, trend lines, and oscillators. Chart analysis can be a valuable tool for traders, as it can help them identify trends and patterns, set stop-loss and take-profit levels, and make more informed trading decisions.
However, it is important to remember that chart analysis is just one aspect of trading, and it is vital to use multiple sources of information and do your own research when making trading decisions. It is also important to understand the risks and limitations of this type of analysis and to consider both technical and fundamental analysis when making trading decisions. (Also Read: The Best Crypto Technical Analysis Software)
Latest
Altcoins
06 Feb 2026
Altcoins
05 Feb 2026
Altcoins
03 Feb 2026
Altcoins
20 Jun 2024
Altcoins
09 May 2024
Altcoins
19 Apr 2024


