Coinposters
Ethereum Has Been Outperforming Bitcoin

Bitcoin (BTC) and Ethereum (ETH) are the most well-known digital cryptocurrencies; their combined market value surpasses 58% of the whole $991.65 billion cryptocurrency market.
BTC is now trading between $20,000 and $20,500, close to the 200-moving average line. However, there is now a large difference between the price and the 200 moving average, suggesting that the price might rise as high as $21,000 to touch the moving average and experience turbulence at that level.
If there is sufficient purchasing pressure in the market and Bitcoin crosses over the 200-day moving average, we may anticipate the price to rise above $24,000. Another possibility is that if the price fails to break through the 200-day moving average and continues to fall, BTC will stay bearish for a few days. The price might go as low as $18,530, its last support level.

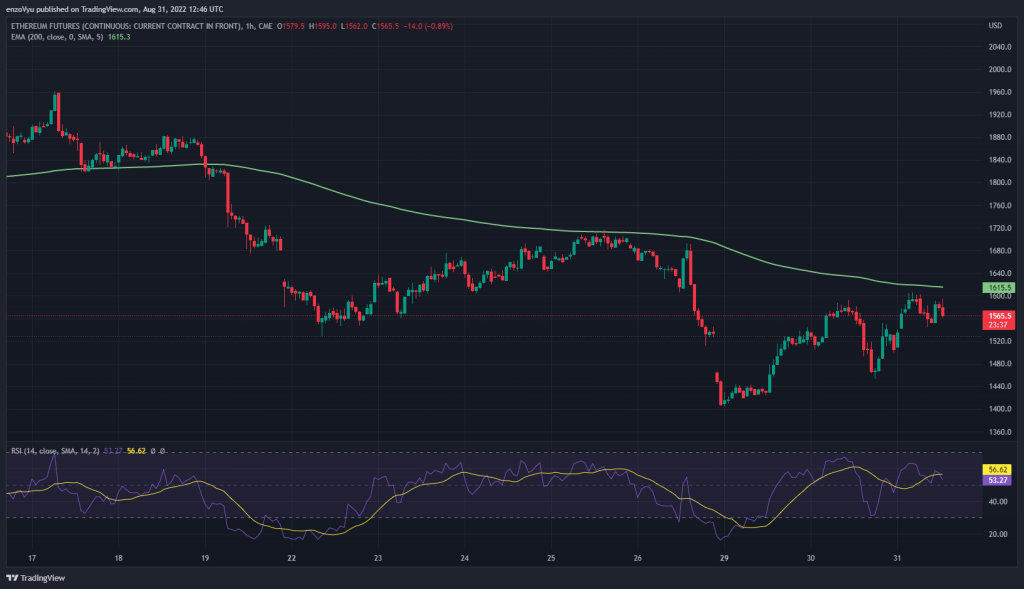
Looking at the 1-hour chart of Ethereum, it has lately been consolidating between $1,545 and $1,600, quite near the 200-day moving average line. When we compare the charts of Bitcoin and Ethereum, we can see that Ethereum has greater movement than Bitcoin. Furthermore, Ethereum is undergoing technical analysis, therefore more traders are interested in it.
The ETH price change, on the other hand, might be due to its imminent PoS merging, which is a less energy-intensive form of the network. Following the merger, ETH may become more appealing and feasible for wider adoption. However, until then, the community is watching to see how investors and companies established on Ethereum’s platform respond to the changes.
However, Ethereum could experience a significant drop before that pump, dropping to as low as $800. Another possibility is that the ETH price will turn positive if it breaks out of the current 200-moving average line, hitting $2,000 in a few days.
Latest
Bitcoin
05 Feb 2026
Bitcoin
03 Feb 2026
Bitcoin
20 Jun 2024
Bitcoin
09 May 2024
Bitcoin
19 Apr 2024


