
James Carter
IOTA Technical Analysis: Understanding the Market Performance of IOTA through Technical Analysis
IOTA is a cryptocurrency that aims to revolutionize the Internet of Things (IoT) industry by facilitating machine-to-machine (M2M) communication and transactions. IOTA’s unique technology, the Tangle, allows for feeless and scalable transactions, making it an attractive option for IoT developers and users. However, like all cryptocurrencies, IOTA is subject to market volatility and price fluctuations. In this article, we will explore IOTA’s market performance through technical analysis.
Introduction
Technical analysis is a way to predict how the price of a security or asset will move in the future by looking at how it has moved in the past. Technical analysts look for patterns and trends in the way prices move by using charts, technical indicators, and other tools. This analysis is based on the concept that looking at how prices have changed in the past can help predict how prices will change in the future. When it comes to cryptocurrencies, technical analysis can be a helpful tool for traders and investors who want to make smart decisions about whether to buy, sell, or hold a certain cryptocurrency.
In the case of IOTA, technical analysis can provide valuable insights into the market performance of the cryptocurrency. By analyzing historical price movements and identifying patterns and trends, traders and investors can make informed decisions about when to buy, sell, or hold IOTA.
IOTA Technical Analysis
To conduct a technical analysis of IOTA, we will use charts, technical indicators, and other tools to analyze historical price movements and identify patterns and trends. We will also evaluate the trading volume and liquidity to gain a better understanding of market sentiment and potential price movements.
A. Chart Analysis of Historical Price Movements
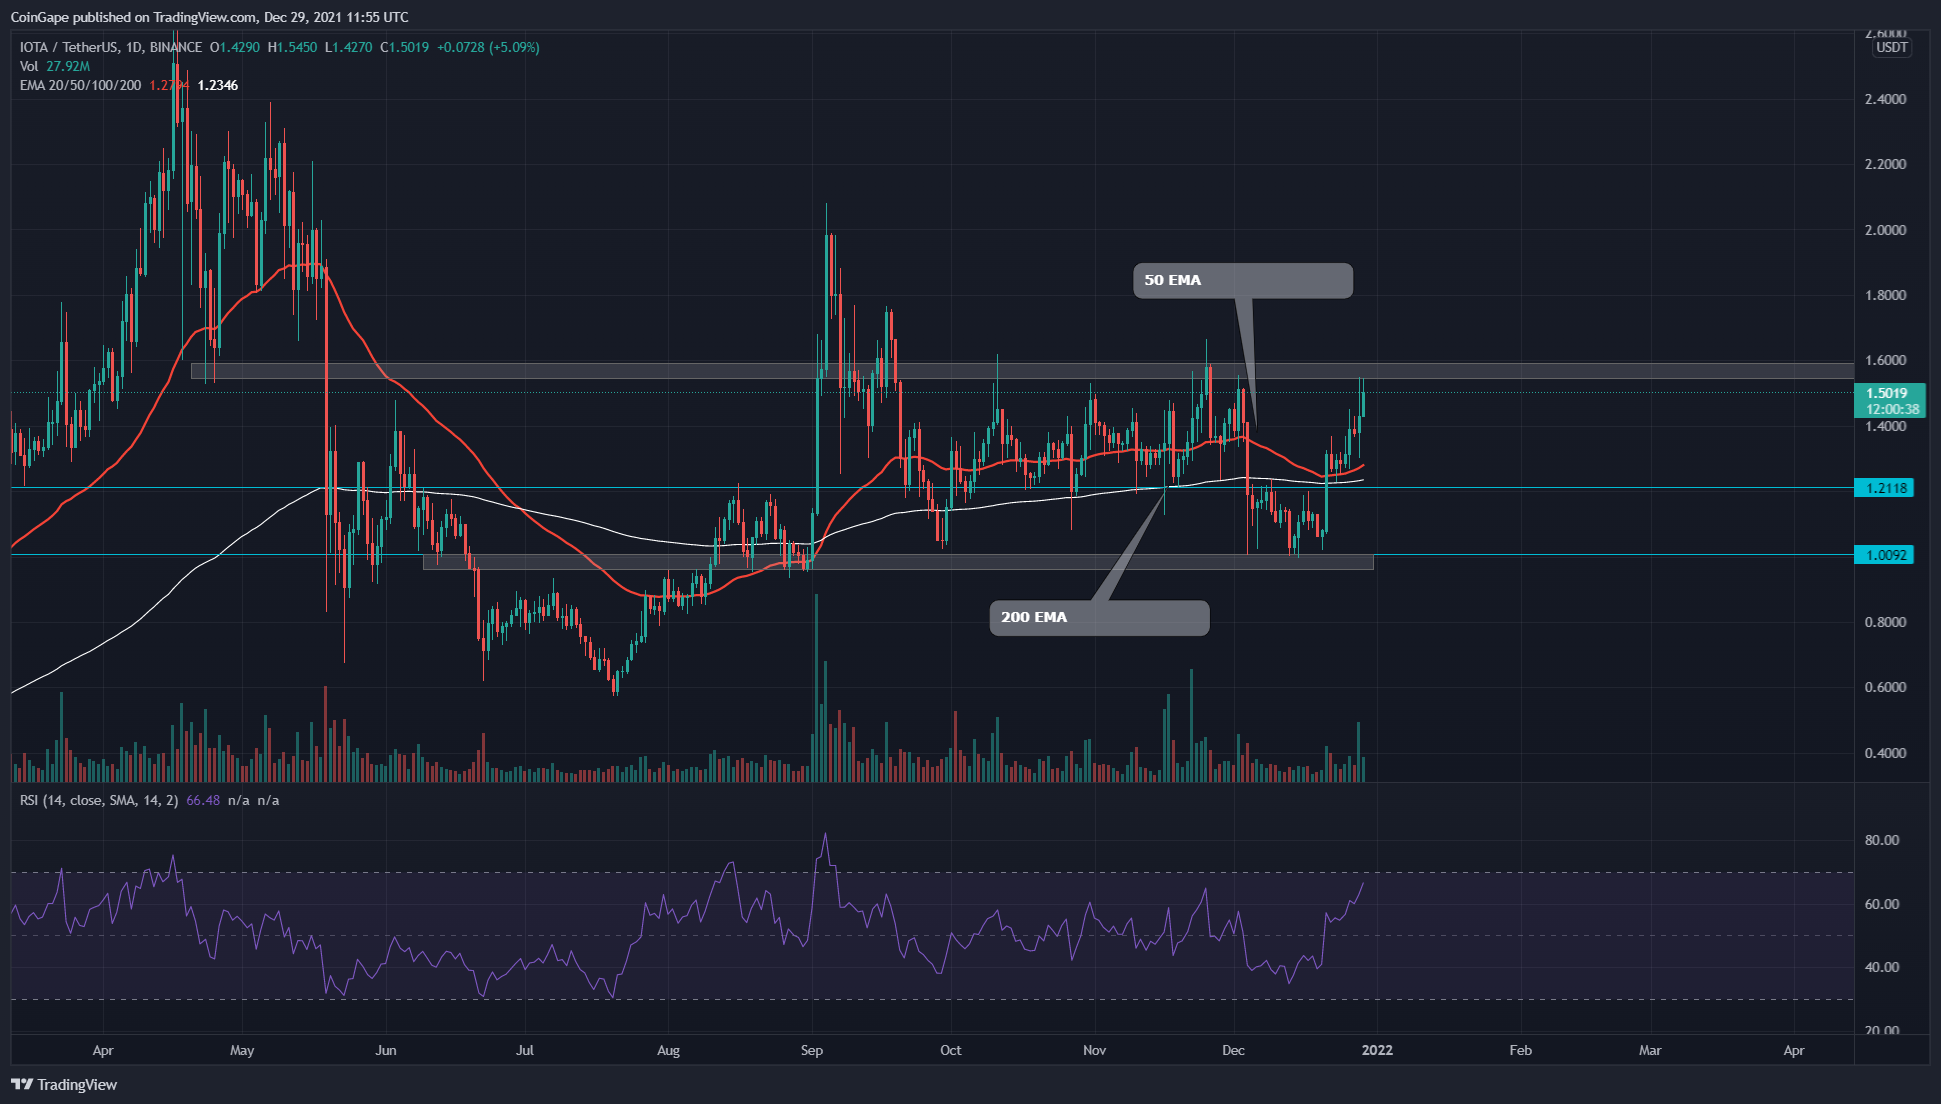
One of the best choices and most widely used tools in technical analysis is chart analysis. Charts allow us to visualize historical price movements and identify patterns and trends. In the case of IOTA, we will use candlestick charts to analyze historical price movements.
Candlestick charts show how prices have changed over a certain amount of time. Each candlestick stands for a certain amount of time, like an hour or a day. The candlestick has a “body” that shows the opening and closing prices for that time period. The “wicks” or “shadows” show the high and low prices for that time period.
By analyzing candlestick charts, we can identify patterns and trends in price movements. For example, we may identify a bullish trend, where prices are consistently rising, or a bearish trend, where prices are consistently falling. We may also identify patterns such as support and resistance levels, which represent price levels where buying or selling pressure is strong.
B. Identification of Key Support and Resistance Levels
Support and resistance levels are key price levels where buying or selling pressure is strong. Support levels represent price levels where buyers are likely to enter the market, while resistance levels represent price levels where sellers are likely to enter the market. By identifying these levels, we can gain insights into potential price movements and make informed decisions about buying, selling, or holding IOTA.
To identify support and resistance levels, we can use a variety of tools, including trend lines, moving averages, and Fibonacci retracements. Trend lines are lines drawn on a chart that connect two or more price points, indicating the direction of a trend. Moving averages are lines that represent the average price over a given period, smoothing out short-term price fluctuations. Fibonacci retracements are lines drawn on a chart that indicate potential levels of support and resistance based on key Fibonacci ratios.
C. Use of Technical Indicators to Analyze Trends and Momentum
Technical indicators calculate trends and momentum. These calculations use price or volume info. Technical markers include RSI, MACD, and moving averages.
Moving averages are a popular technical predictor. They reveal trends and reversals. SMA and EMA are the most common moving averages (EMA). A crossing of the shorter-term moving average above the longer-term moving average is bullish, while a crossover below it is bearish.
Another type of technical predictor that is frequently utilized is called the relative strength index (RSI). The relative strength index (RSI) looks at how strong a security’s market action is by comparing the average gains to the average losses over a certain amount of time. Readings above 70 on the RSI indicate that conditions have become overbought, and readings below 30 indicate that conditions have become oversold. The RSI is displayed on a scale that ranges from 0 to 100.
The moving average convergence and divergence indicators examine the relationship between two moving averages. By subtracting the 26-period EMA from the 12-period EMA, the MACD is determined. To generate buy and sell signals, a signal line, usually a 9-period EMA, is plotted on top of the MACD line.
D. Evaluation of Trading Volume and Liquidity
When performing a technical analysis of IOTA, in addition to chart analysis and technical indicators, it is essential to take into consideration the trading volume and liquidity of the market. The total number of shares or contracts that are traded during a specific time period is referred to as the trading volume, and the ability to purchase or sell a security without significantly affecting its price is referred to as the liquidity of the market.
High trading volume and liquidity can indicate strong market sentiment and potential price movements, while low trading volume and liquidity can indicate a lack of interest or uncertainty in the market. When evaluating trading volume and liquidity, it is important to consider both short-term and long-term trends.
Trend Analysis
Once we have conducted a technical analysis of IOTA using chart analysis, support and resistance levels, technical indicators, and trading volume and liquidity, we can begin to analyze trends in price movements. Trend analysis involves identifying short-term, medium-term, and long-term trends, as well as analyzing trend strength and potential trend reversal points.
A. Identification of Short-term, Medium-term, and Long-term Trends
Short-term trends refer to price movements over a period of days or weeks, while medium-term trends refer to price movements over a period of weeks or months, and long-term trends refer to price movements over a period of months or years. By identifying these trends, we can gain insights into potential price movements and make informed decisions about buying, selling, or holding IOTA.
B. Use of Moving Averages to Identify Trend Direction
Moving averages also be used to identify the direction of a trend. As mentioned earlier, a crossover of the shorter-term moving average above the longer-term moving average can indicate a bullish trend, while a crossover of the shorter-term moving average below the longer-term moving average can indicate a bearish trend.
We can use moving averages of different periods to identify short-term, medium-term, and long-term trends. For example, a 20-day moving average can be used to identify short-term trends, while a 50-day moving average can be used to identify medium-term trends, and a 200-day moving average can be used to identify long-term trends.
C. Analysis of Trend Strength and Potential Trend Reversal Points
In addition to identifying trends, it is important to analyze trend strength and potential trend reversal points. Trend strength can be evaluated using technical indicators such as the RSI and MACD, which can indicate overbought and oversold conditions and potential trend reversals.
Support and resistance levels and trend lines can also be used to find places where a trend might change. If security breaks through a support level, it could mean that the trend is changing from bullish to bearish. On the other hand, if security breaks through a resistance level, it could mean that the trend is changing from bearish to bullish.
WATCH THE VIDEO BELOW FOR MORE CLARIFICATION
Risk Management
Once we have conducted a technical analysis of IOTA and analyzed trends in price movements, it is important to consider risk management strategies to mitigate potential losses and maximize potential gains.
A. Use of Stop Loss Orders
The utilization of stop-loss orders is one method that can be utilized for risk management. An order to sell a security if it achieves a certain price level is known as a stop-loss order. This type of order can help limit potential losses that may occur if the price of the security falls.
B. Diversification of Investments
Investing in different types of assets is another way to spread out potential losses. Diversifying a portfolio means putting money into a number of different types of investments rather than just one.
C. Use of Position Sizing
Another method for minimizing risk is position sizing, which entails allocating a reasonable sum to each transaction. Potential losses can be minimized, and potential profits amplified through the use of position sizing by investors.
Summary
conducting a technical analysis of IOTA can provide valuable insights into potential price movements and trends. By using chart analysis, support and resistance levels, technical indicators, and evaluating trading volume and liquidity, investors can identify short-term, medium-term, and long-term trends and make informed decisions about buying, selling, or holding IOTA.
by analyzing trend strength and potential trend reversal points and implementing risk management strategies such as stop loss orders, diversification of investments, and position sizing, investors can mitigate potential losses and maximize potential gains.


Latest
Markets
16 Jan 2024
Markets
31 Aug 2023
Markets
24 Jun 2023
Markets
24 Jun 2023
Markets
24 Jun 2023
Markets
23 Jun 2023
Recent News

Bitcoin
24 Jun 2023

Blockchain
24 Jun 2023

Blockchain
24 Jun 2023

Altcoins
24 Jun 2023

Bitcoin
24 Jun 2023

Altcoins
24 Jun 2023

Bitcoin
23 Jun 2023

News
23 Jun 2023